Tuesday, March 25, 2025

Nifty Gann Square of 9 – Price Action at Its Best!

 Gann Square of 9 is simplest and powerful way to get key price action support and resistance levels.

It is important to identify the key angle on Gann square of 9 that provides pivot levels that can provide support or resistance to prices.

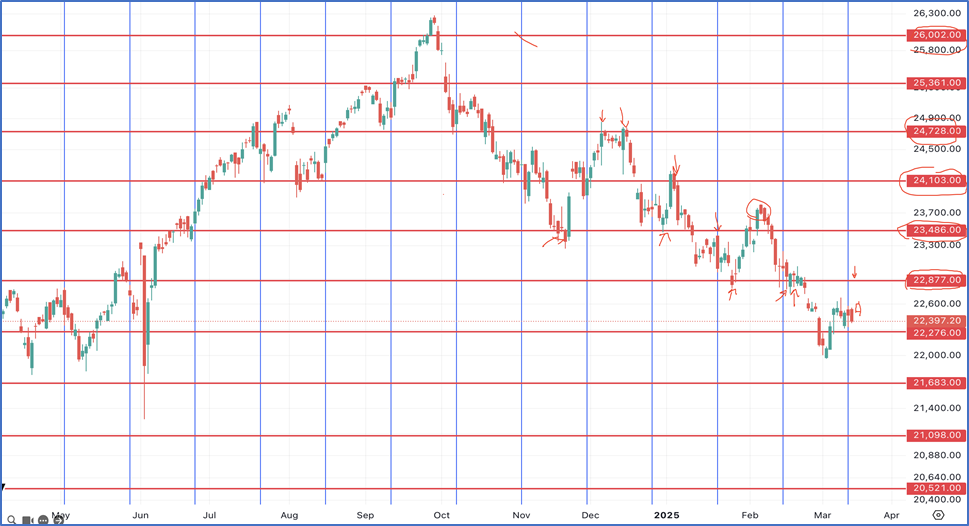
Below chart was discussed during the webinar which showed a possible move to 22877 on upside when prices were near 22397 on 13th March 2025.

Nifty Gann square of 9 – Anticipated on 13th March 2025
Happened as on 20th March 2025
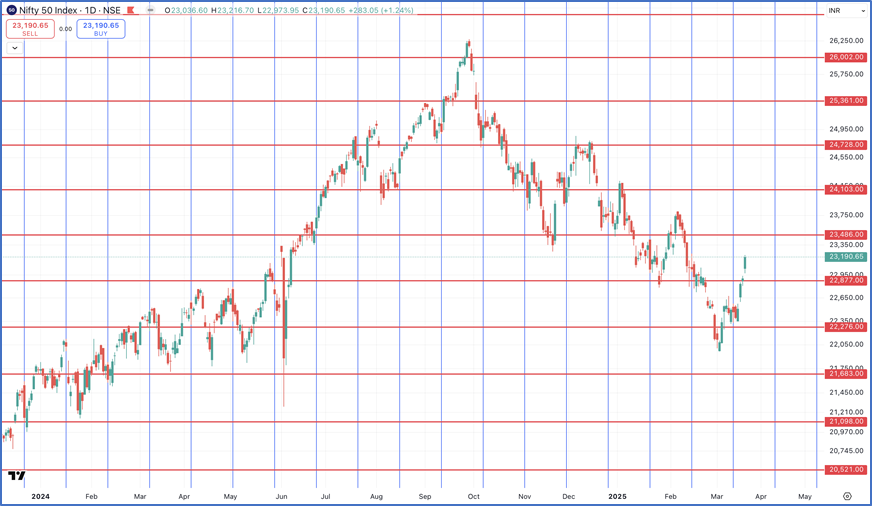
Nifty has been moving between the Gann square of 9 levels which is of 180 degrees. These levels have been acting as support or resistance on most of the occasions.

We can clearly see form the above anticipated chart that prices managed to bounce back from 22276 levels which opened up the possible target for 22877 levels on upside.

This prediction was done when majority of the traders were on the negative sentiments and expected prices to move lower.

But Neo wave, Time cycle and Gann levels helped us to change the stand from bearish to bullish side over short term and it worked out extremely well.

Now on upside the next hurdle level of 23486. As short term indicators are overbought it is best to use dips to buy with support near 22877. Any breach below this level will be a sign of reversal.

In a nutshell,  by using this sacred science of Trading – Gann sq of 9 and Hurst’s Time cycle it is possible to trade with edge of Time and Price action.

Kaal Chakra (Master of Cycles) – Learn the science of Hurst’s Time cycle along with Gann square of 9, KST momentum indicator, Pring Special Time indicator, FLD for price target in upcoming 5th – 6th April 2025 training sessions – know more over here

Brahmastra (Mentorship on Timing the market) – Over period of 3 months Equip yourself with all the tools to trade the market with an edge of Time, Elliott wave, Neo wave, Options strategy, access to a private community group, stock selection scanner, Multibagger and Momentum stock identification technique, Mentorship sessions for the complete trading journey.Know more here

Wednesday, March 19, 2025

Nifty 15 Minutes Hurst’s Time cycle Forecasting – Must See

 It is possible to Time the market by using concepts of Hurst’s Time cycle along with Gann square of 9.

It is crucial to combine price action techniques along with Time cycles and sacred science of Gann square of 9. This will give the much-needed edge for traders especially in Options trading.

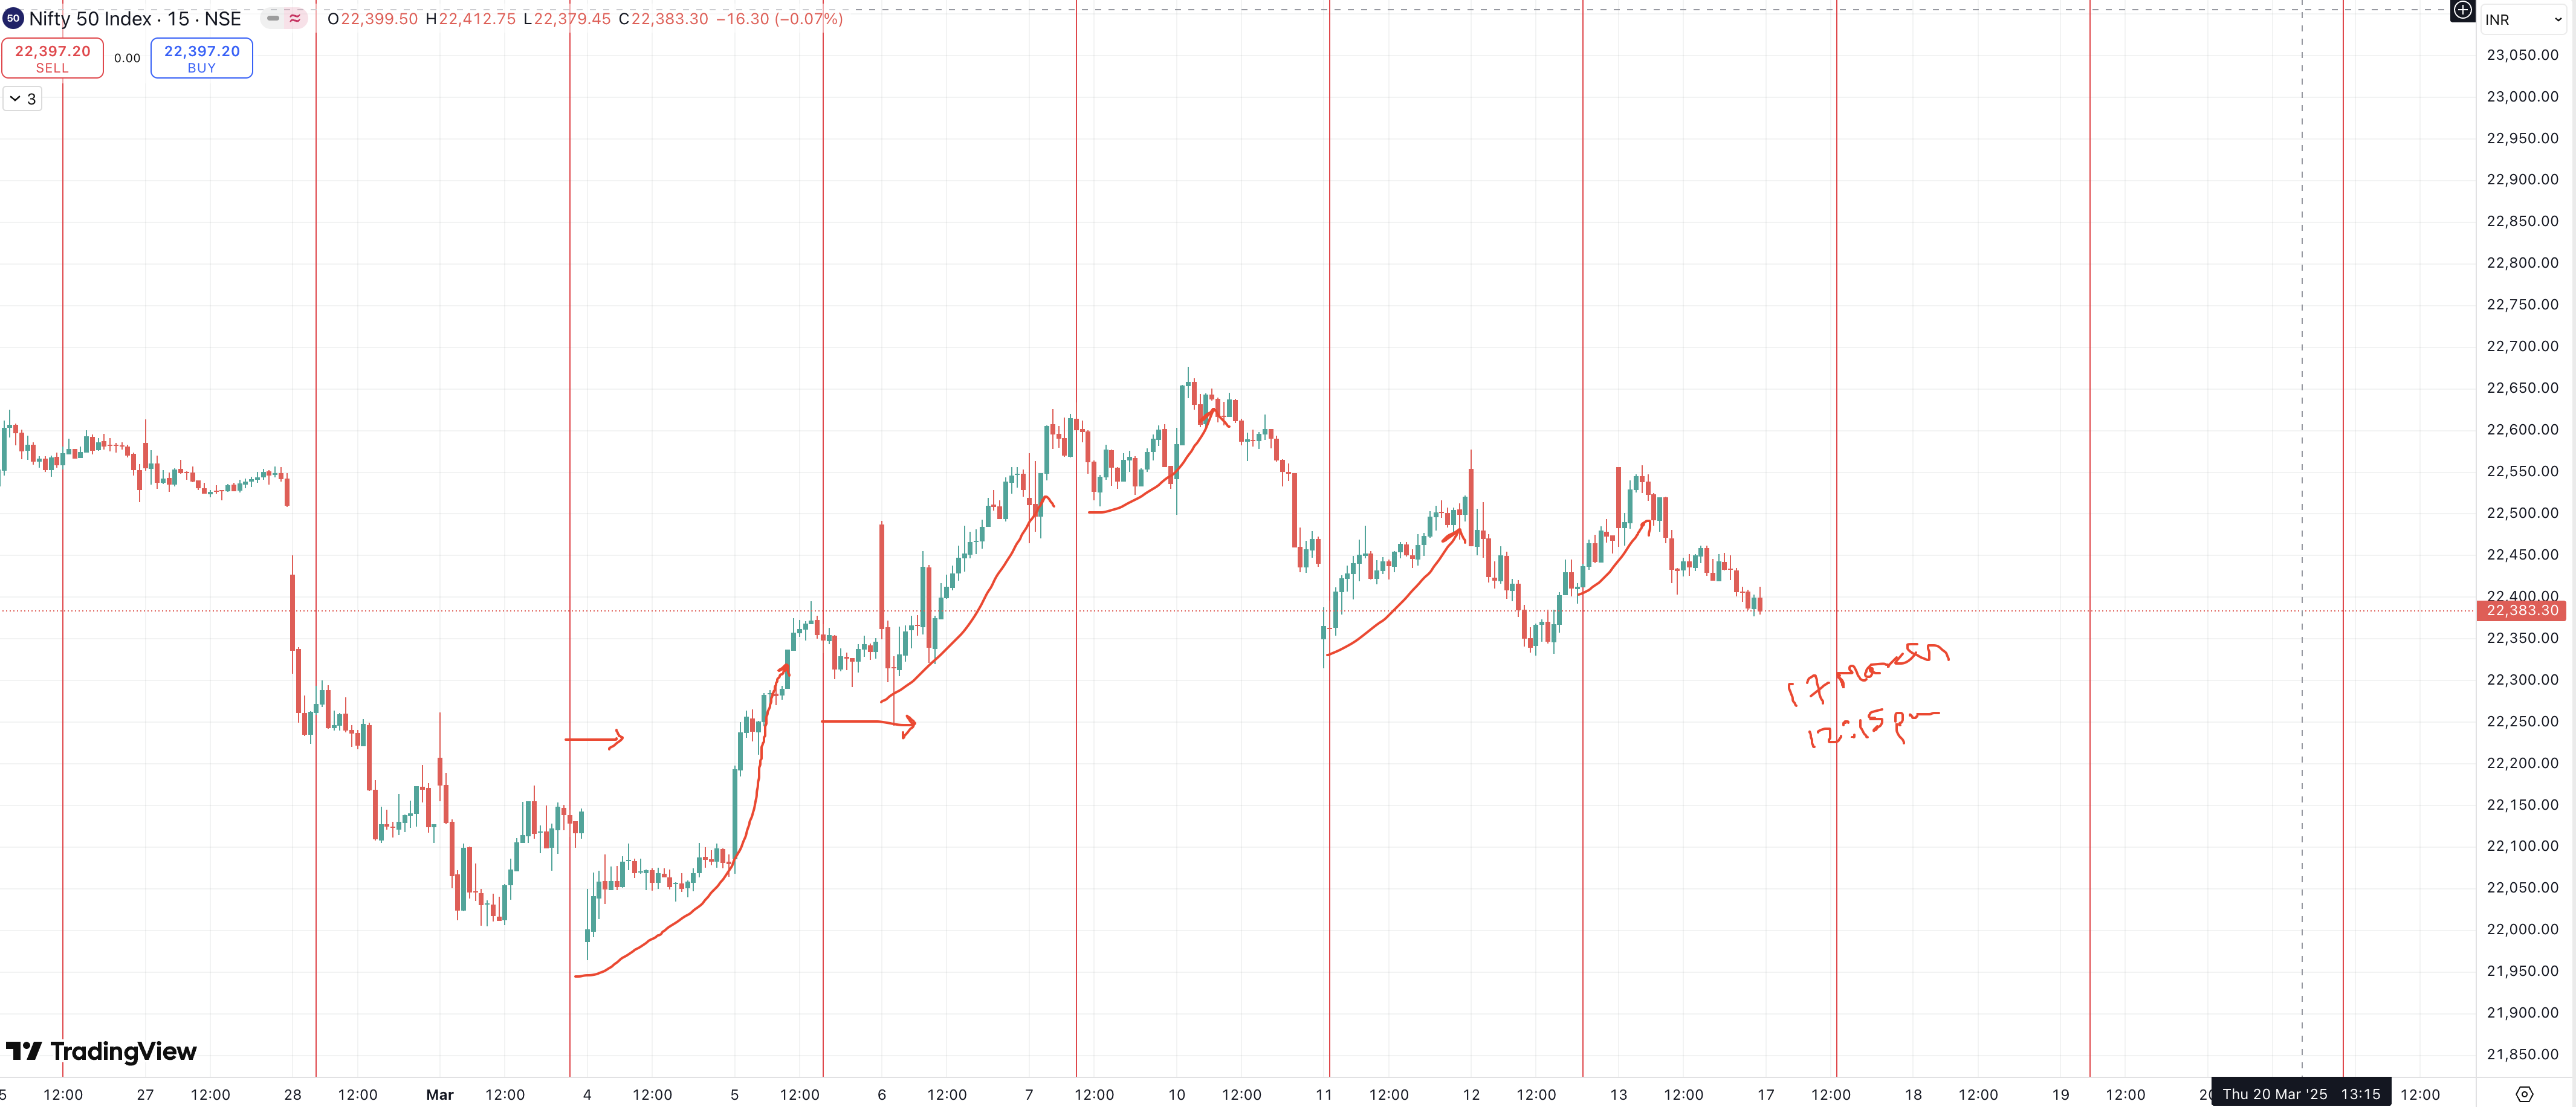
Nifty 15 minutes chart - Anticipated
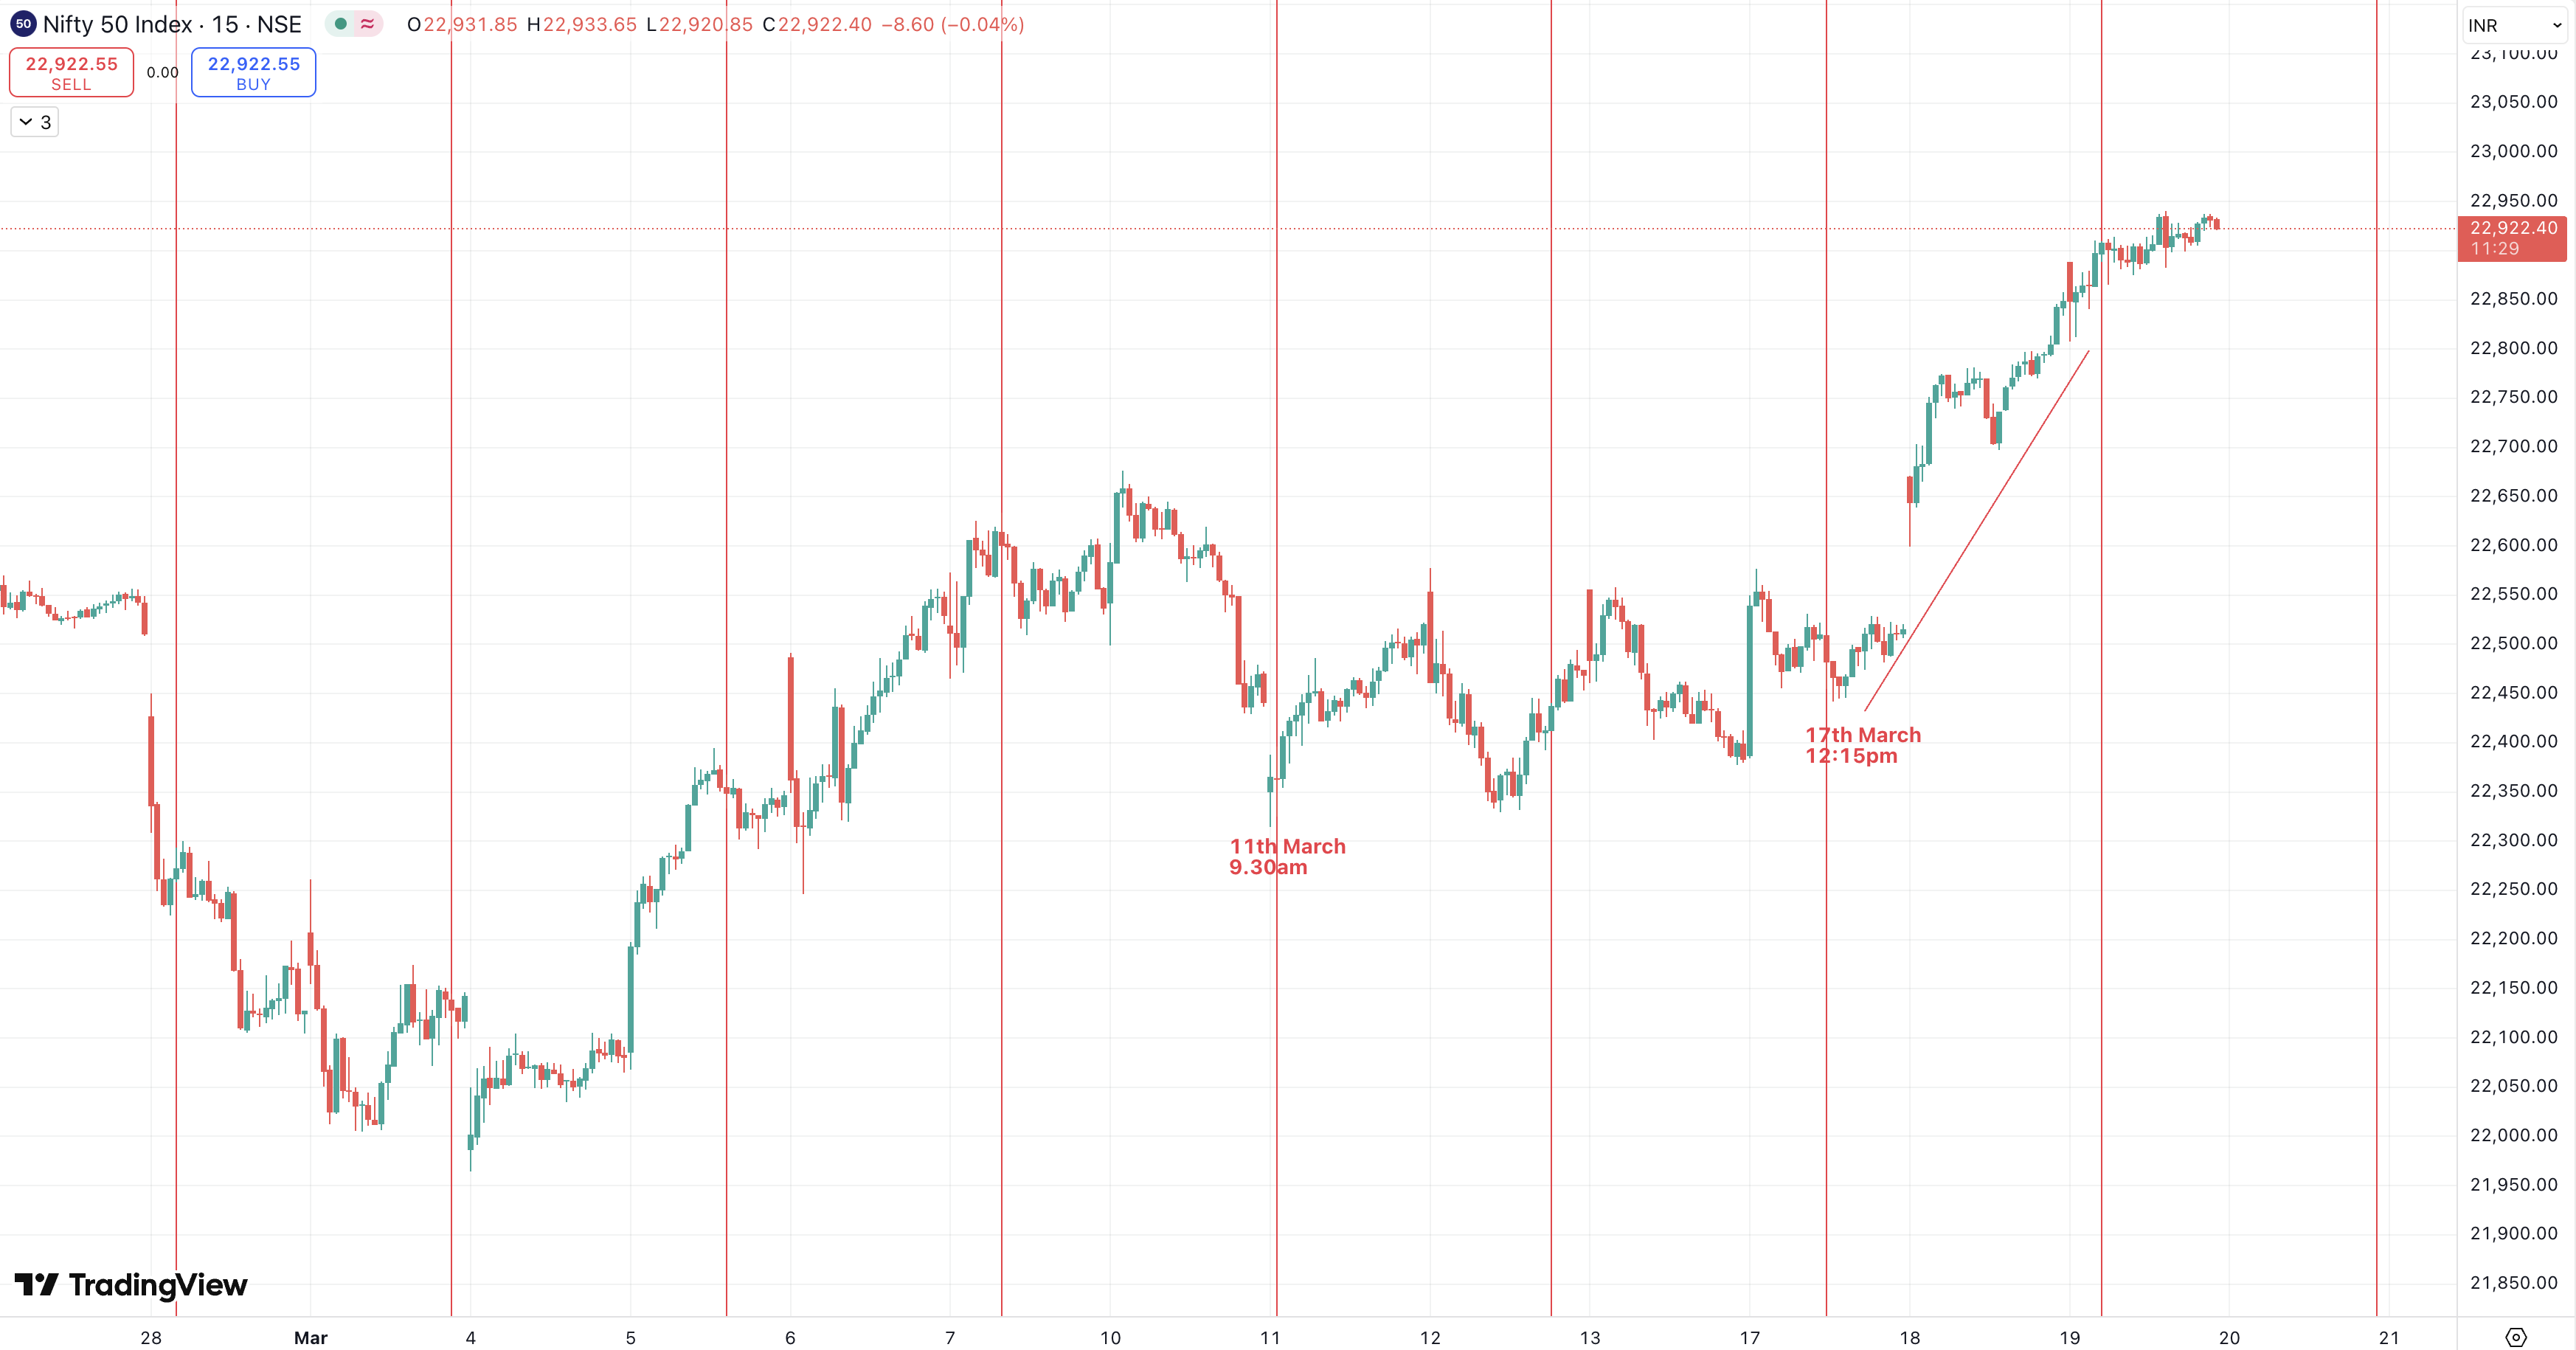
Nifty 15 minutes chart: Happened
Nifty 15 mins chart shows 43 period Time cycle which is plotted as per Hurst’s Time cycle concept. As per this chart, prices have tendency to reverse on the upside.

Anticipated: We discussed this time when prices were near 22383 levels and expected an upside move from 17th March 12:15 pm.

Happened: Nifty formed a low near 23440 on 17th March and rallied by more than 500 points in less than 2 days. This clearly shows at times the concept of Time cycle works so precisely. This happened when majority of the traders were not sure about the direction of breakout and we mentioned that there is strong positive breakout possible as time turns up.

In a nutshell, by using Hurst’s Time cycles one can time the turn to the very day, hour and at time to very minute. It needs to be combined with Price action techniques. Also it is possible to forecast price targets using Time by using the concepts of FLD. Above that using Gann square of 9 provides complete trading system & different angle to see the markets.

Kaal Chakra (Master of Cycles) – Learn the science of Hurst’s Time cycle along with Gann square of 9, KST momentum indicator, Pring Special Time indicator, FLD for price target in upcoming 5th – 6th April 2025 training sessions – know more over here

Brahmastra (Mentorship on Timing the market) – Over period of 3 months Equip yourself with all the tools to trade the market with an edge of Time, Elliott wave, Neo wave, Options strategy, access to a private community group, stock selection scanner, Multibagger and Momentum stock identification technique, Mentorship sessions for the complete trading journey. Know more here

Monday, March 17, 2025

Is it Possible to catch early Reversals in Gold?

 It is fascinating to see how accurately Time cycles can predict early reversals on the Gold, the same way as stocks or indices.

We derived a path for Gold in our past weekend webinar held on 1st March 2025 with 1000’s of participants. Below is the chart which shows a detailed path of Gold which we derived earlier.

Gold Daily Chart: Anticipated as on 1st March 2025 in Weekend webinar.
Gold Daily Chart: Happened as on 17th March 2025.
Time cycle works like magic for capturing lows before they have already happened. For Gold, 51 period of Time cycle works extremely well on the daily time frame. Time trading has to be combined along with price action for precise entry. On the above chart, we can see that every time prices are near the cycle zone, prices have formed a low and a pullback on the upside have witnessed.

As anticipated on our Weekend webinar held on 01st March 2025 that Gold might witness a minor dip post which we can a expect a sharp rise in the asset.

Gold moved precisely as expected and BANG ON!! Gold witnessed a minor dip near important support of 83900 levels and thereafter Gold reversed on the upside and witnessed a rise of more than 4000 points.

The next cycle is due on 17th April 2024 and until then we expect Gold to protect its previous cycle low i.e. 83880 until 17th April 2024.

In a nutshell, the current trend for Gold continued to be on the side of the bulls as per the concepts of Time trading. As of now, one should use dips as a buying opportunity for better risk reward which can bring out the targets of 88300 or higher. On the downside, 87000 is the crucial support.

Want to know more about accurate gold reports? Subscribe to our Vayu Short-Term Update and get gold strategies every week. Check here

Brahmastra (Mentorship) on Trading – Learn the science of forecasting using Time and Elliott wave, Neo wave along with risk money management, stock selection algo, and Options trading with a complete plan. Limited seats only, The Next batch starts in March 2025. Know more here

Wednesday, March 12, 2025

Is it possible to time the market using 43 period time cycles?

 It is fascinating to see how accurately Time cycles can predict early reversals on the Nifty Index, in the same way as stocks.

Time Cycle is a Technical Analysis study and is surprising that such concepts can help time the market and catch early reversals which improves decision making of the traders. When we combine Time trading with price action it leads to interesting results!

We derived a path for Nifty in our past Saturday webinar held on 8th March 2025. Below is the chart which shows a detailed path of Nifty which we posted earlier.

Nifty 15 min chart: Anticipated as on 08th March 2025.
Nifty 15 min chart: Happened as on 12th March 2025.
Time cycle
 works well to catch early reversals even on shorter time frames like 15 mins, 5 mins. For Nifty, 43 period of Time cycle works extremely well on the 15-min frame. Time trading has to be combined along with price action for precise entry. On the above chart, we can see that every time prices are near the cycle zone we have seen a pullback on the upside.

As anticipated on our Saturday webinar held on 08th March 2025 that the Index will form a short-term low near our cycle zone which was due on 11th March 2025 at 9:30 AM.

Index moved precisely as expected and BANG ON!! Nifty formed a low of 22325 levels on 11th March at 9:30 AM and thereafter prices witnessed a sharp pullback of more than 250 points on the upside despite USA markets crashing and increasing concerns over economic slowdown. This is the power of time trading.

For now, Nifty is moving towards next cycle zone which is due today, 12th March at 2PM. One can look out for buying opportunity near the same.

So, by combining this science of Time trading one need not worry about missing out the trend as if time is in favour, then one can predict moves well in advance.

Brahmastra (Mentorship) on Trading – Learn the science of forecasting using Time and Elliott wave, Neo wave along with risk money management, stock selection algo, and Options trading with a complete plan. Limited seats only, The Next batch starts in March 2025. Know more here

Tuesday, March 11, 2025

How CRAFTSMAN Achieved a 18% Rally – Price Patterns & ADX Insights

 When combining basic price patterns with technical indicators like ADX, it can lead to remarkable results in trading. See how we captured a significant move in Craftsman Automation Ltd stock by applying the ADX momentum strategy. Check out how the stock rallied by more than 18% after our prediction.

We published the following research on Craftsman Automation Ltd on 03rd March 2025 in the “Vayu Momentum Report” which our subscribers receive pre-market every day.

CRAFTSMAN Daily chart Anticipated as on 03rd March 2025
Wave Analysis as on 03rd March 2025:

CRAFTSMAN closed on a positive note with a massive gain of 7.67%.  The stock has formed a rounding bottom pattern. On the daily chart, Price has closed above 4473 which confirms breakout of the said pattern. Also, ADX is suggesting strong momentum can continue in this stock as it is showing readings of 35.15 which is above 25. For now, one should use buy on dips approach to ride the trend.

Key Resistance: 4800

Key Support: 4260

Strategy: Use dips towards 4420-4460 as a buying opportunity for a move towards 4760-4800 levels as long as 4260 holds on the downside.

CRAFTSMAN Daily chart Happened as on 11th March 2025
Happened: After we published the report, the stock moved in sync with our expectations. Craftsman showed a rise of more than 18% in just a matter of 7 trading sessions and BANG ON!! Prices managed to achieve both our given targets and made a high of 5247 levels. We successfully captured this entire rise by simple price action and ADX.

It is fascinating to see how accurately combining basic indicators like ADX along with price action can help to predict price targets with accuracy.

Want to know more about such stocks CRAFTSMAN is on the mark! subscribe to our Vayu Short-Term Update: Get a list of stocks with high growth potential: Check Here

Brahmastra (Mentorship) on Trading – Learn the science of forecasting using Time and Elliott wave, Neo wave along with risk money management, stock selection algo, Options trading with complete plan. Limited seats only, Next batch starts in March 2025. Know more here