Wednesday, September 17, 2025

Bank Nifty Surged 1800 Points – Here’s How We Saw It Coming

 Two important ingredients of predicting market are Time and Price action. It is possible to Time the market and trade in direction of trend.

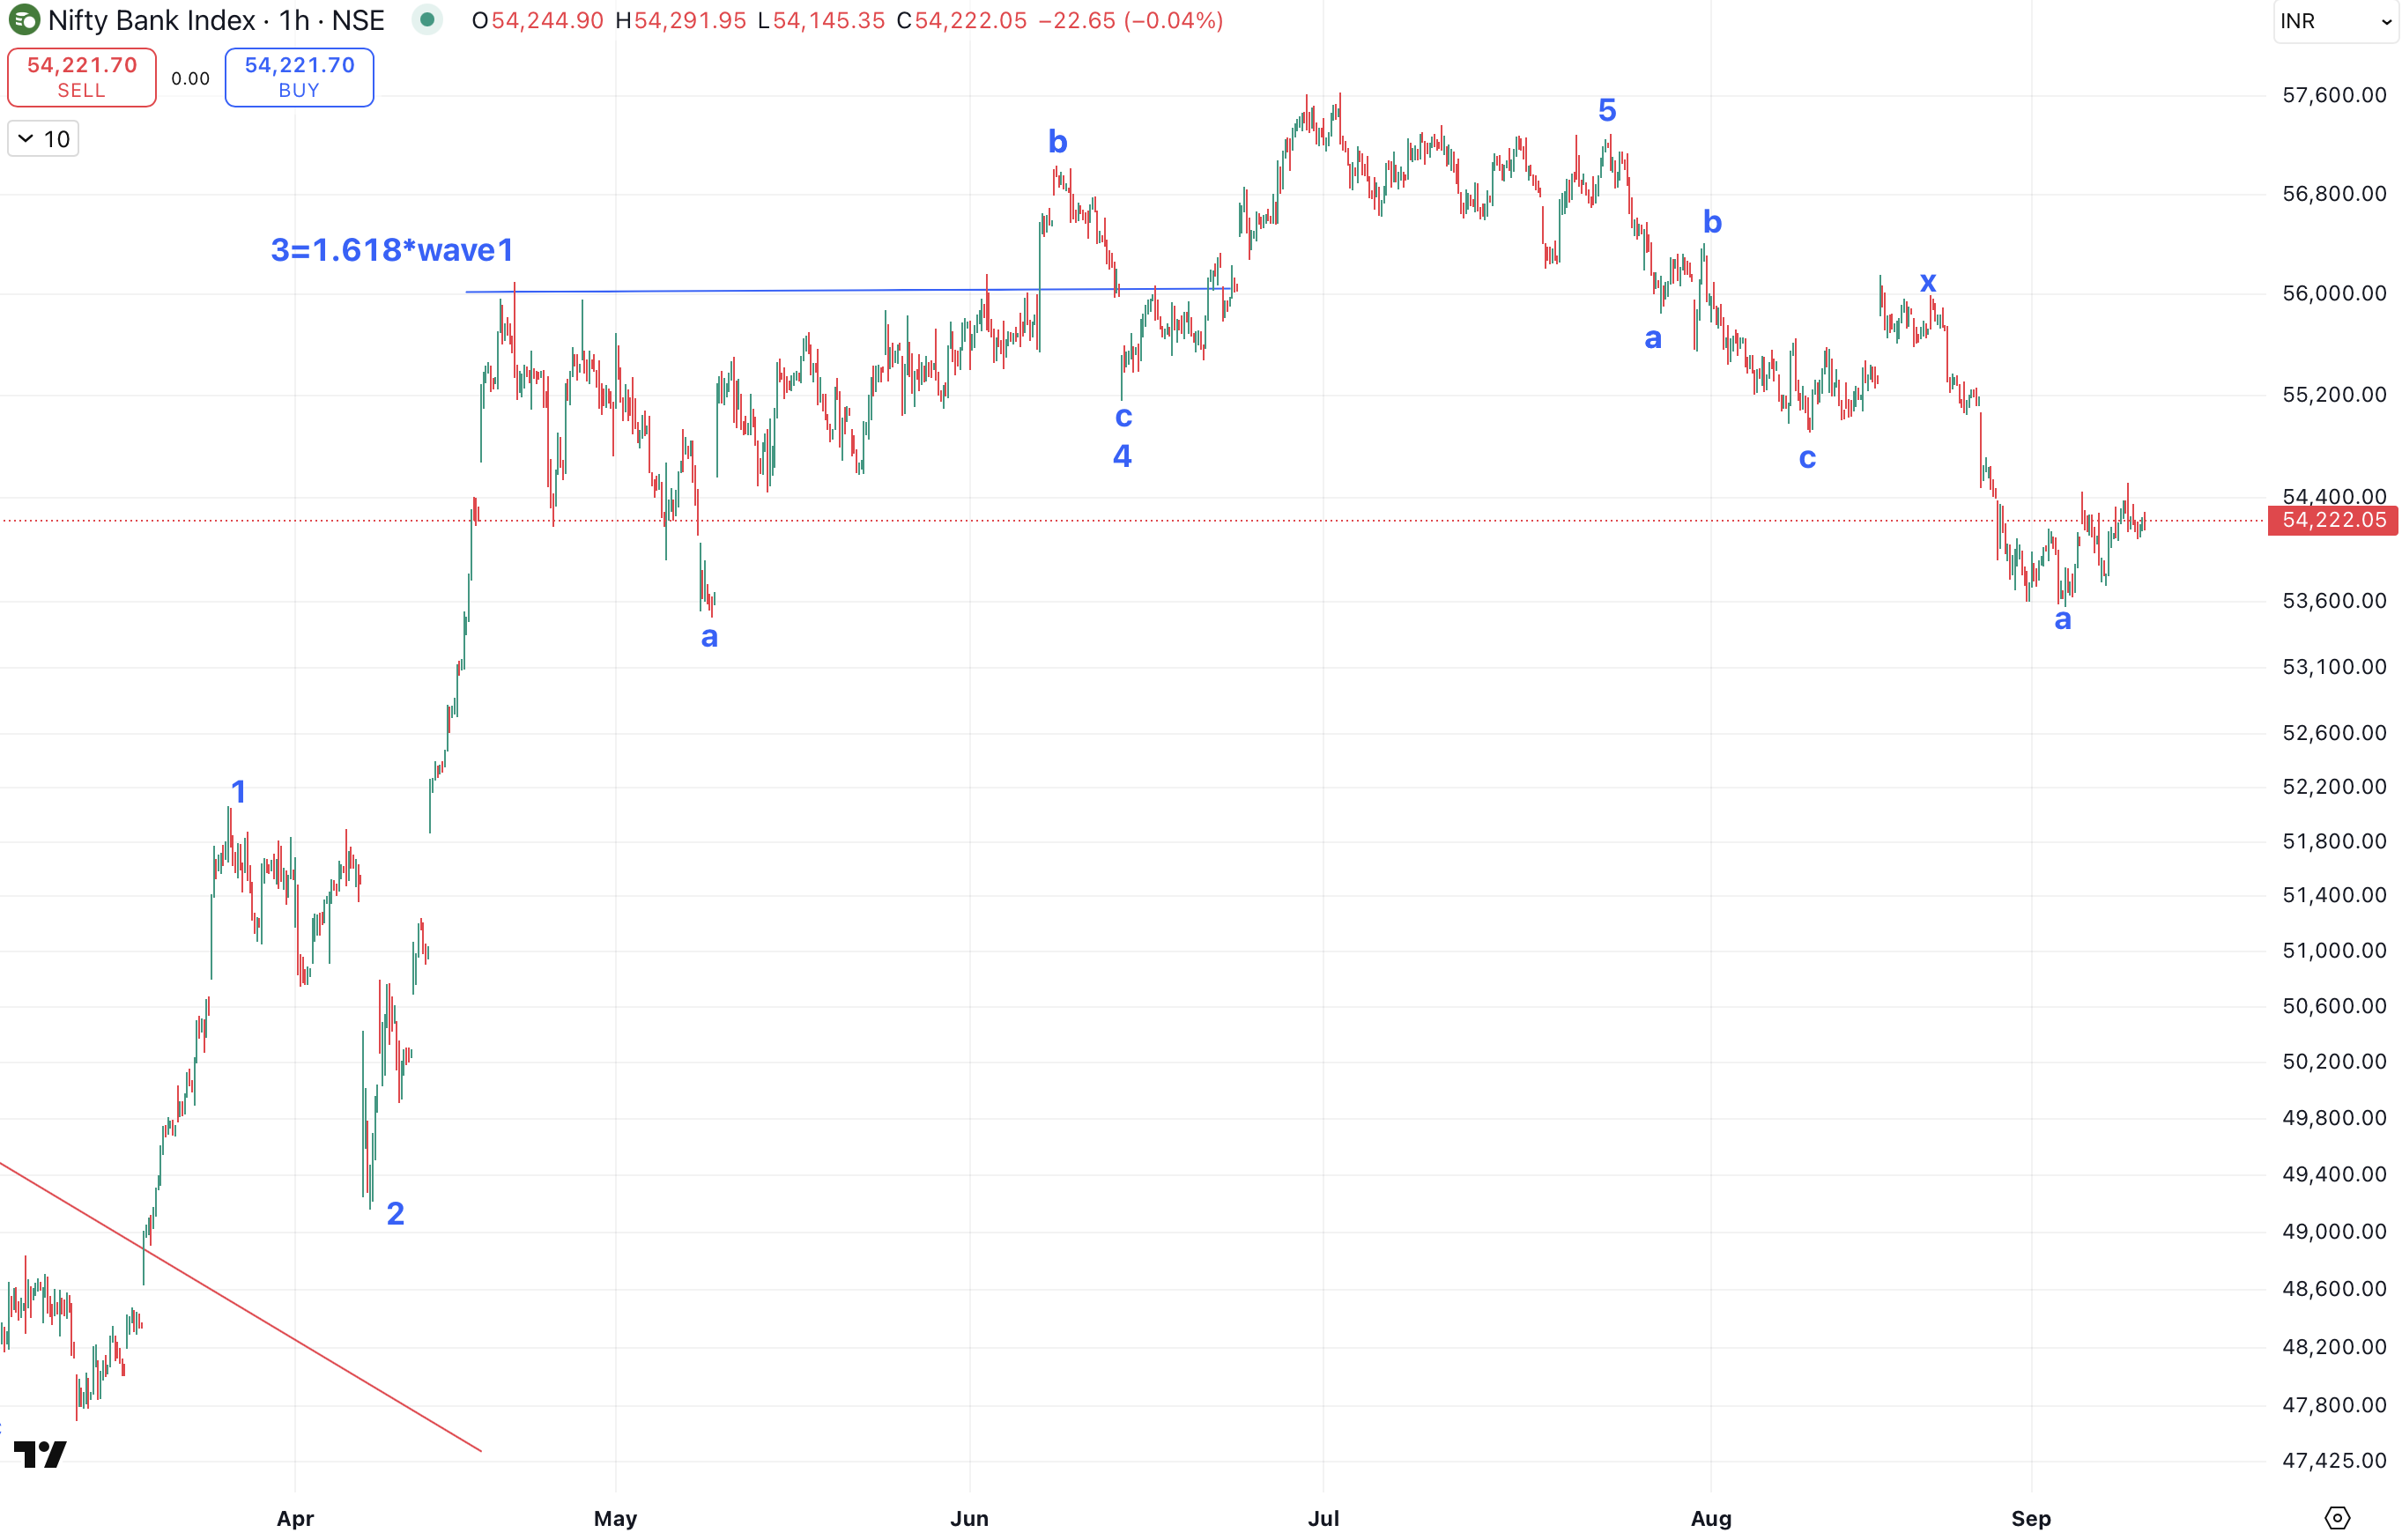
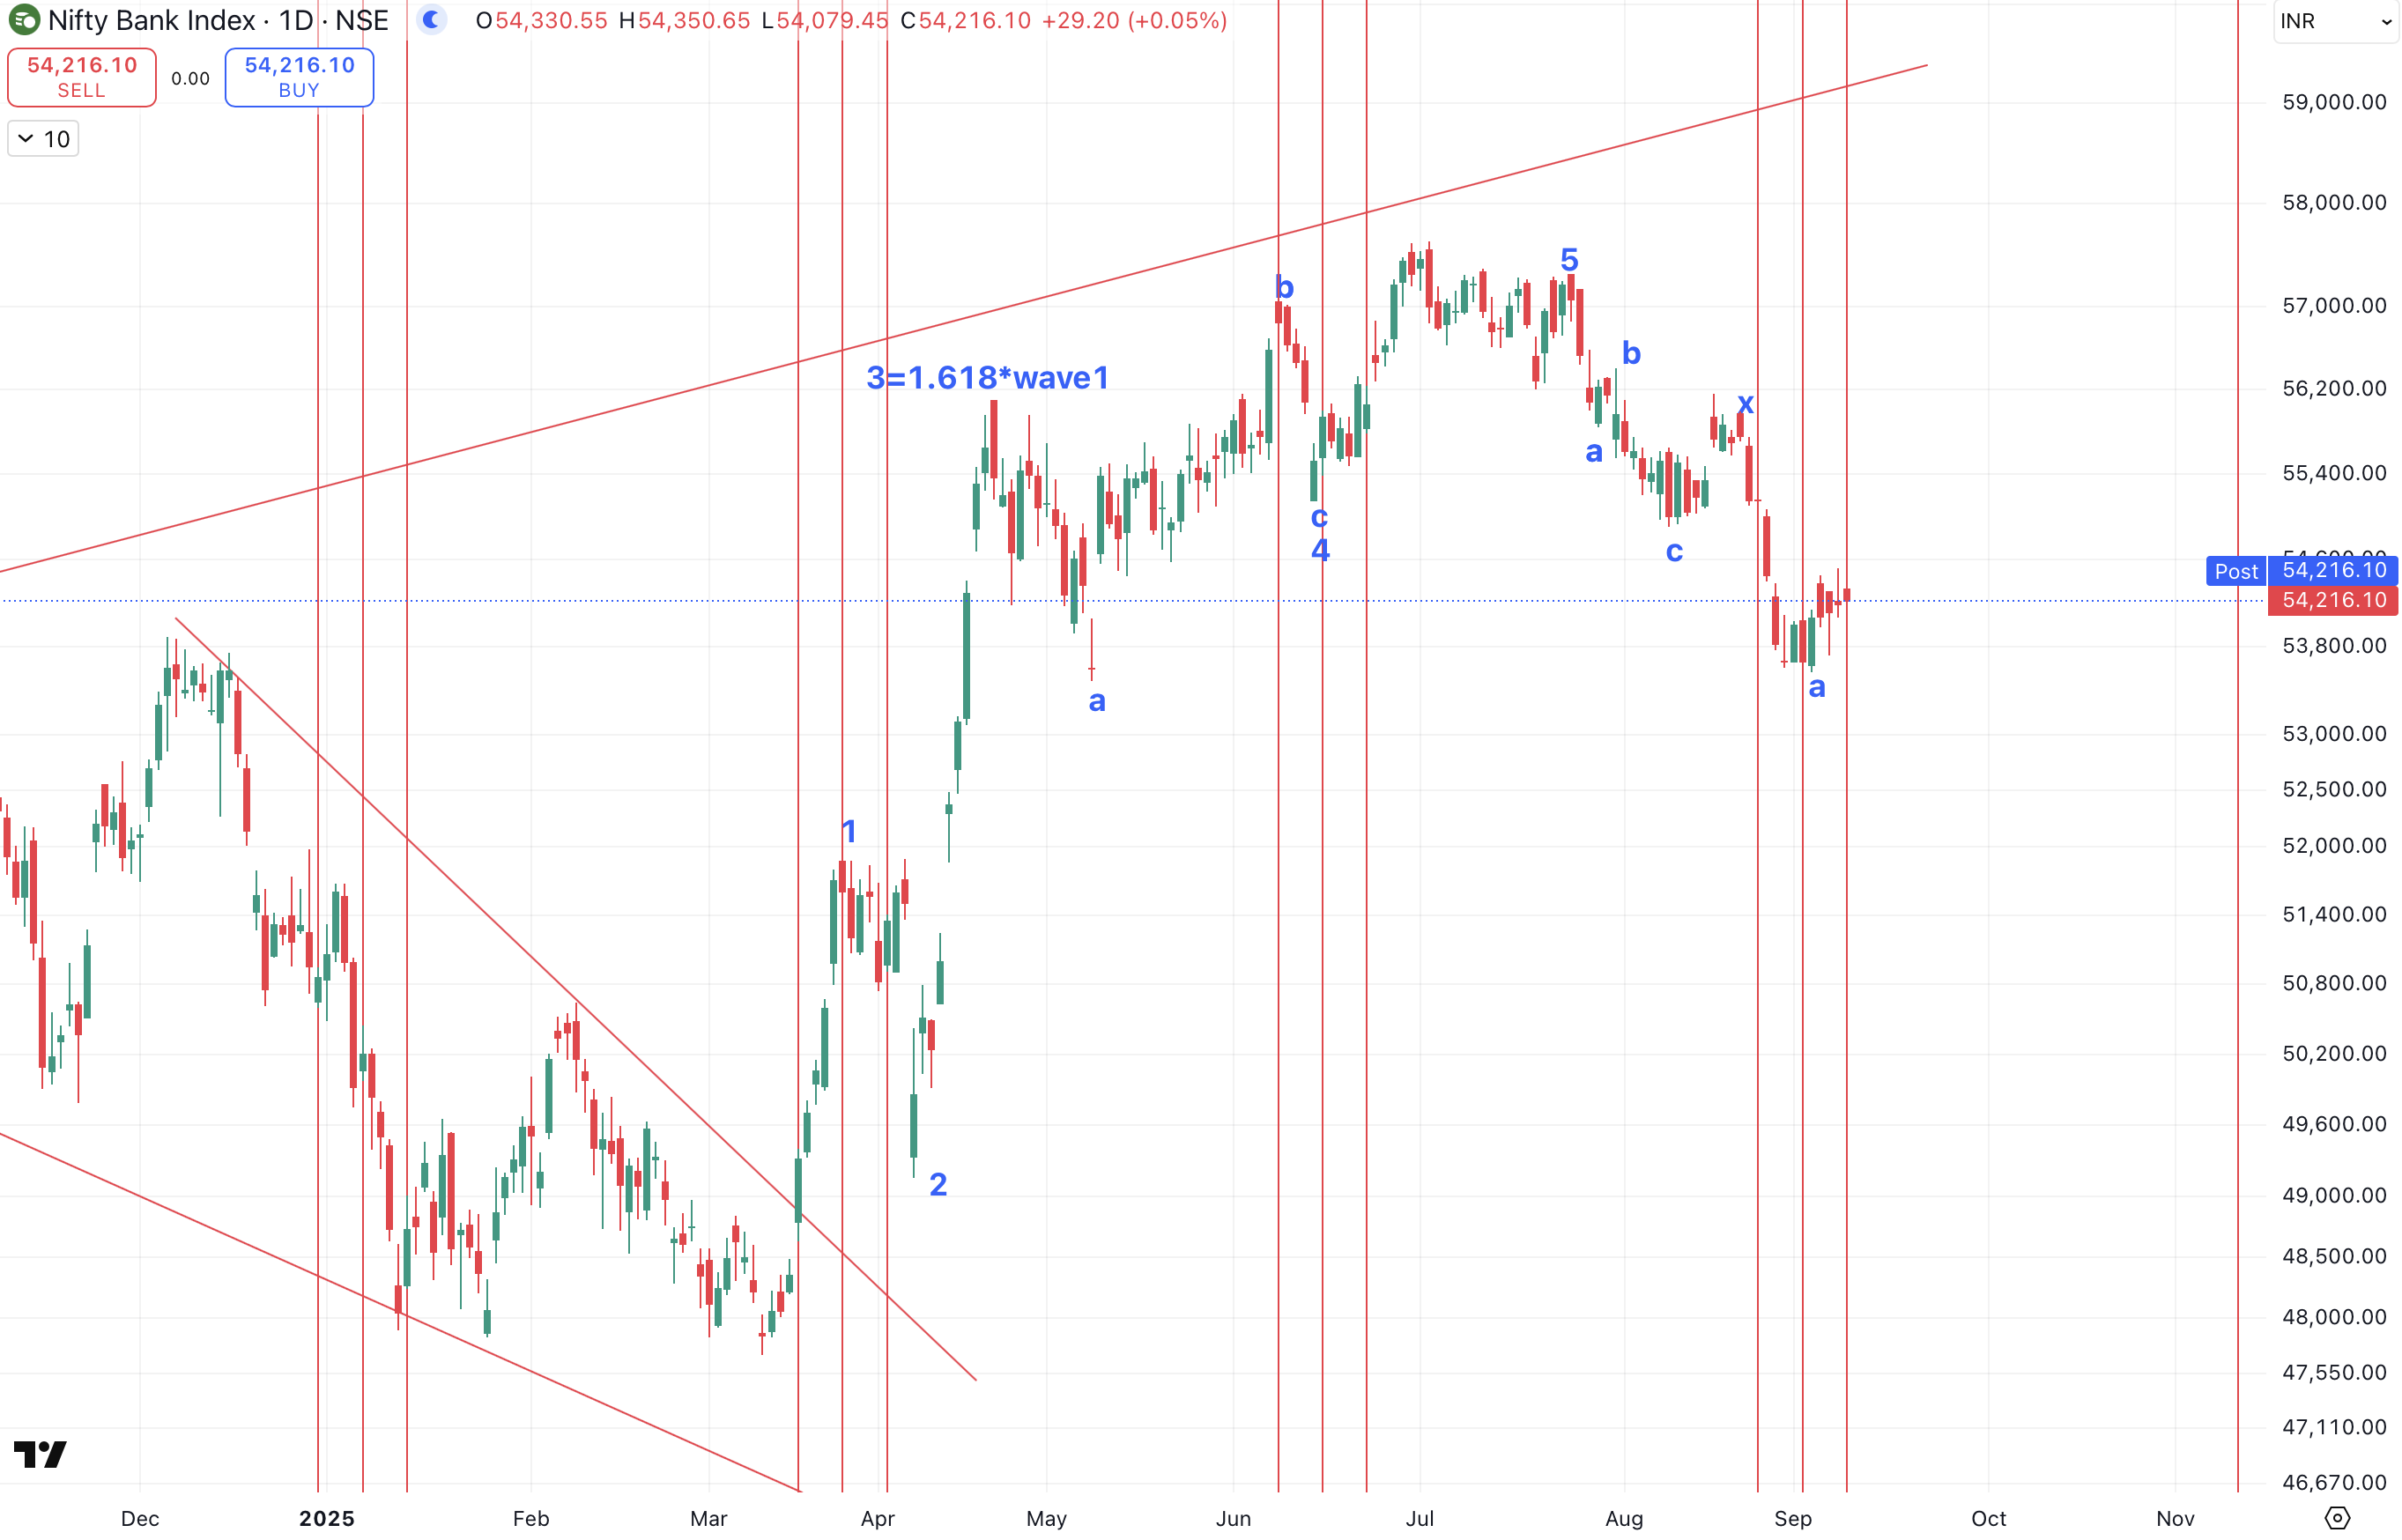
Time cycle works well to catch early reversals even on Index. For Bank Nifty54 Days Time Cycle works extremely well on daily time frame. See the detailed research on Bank Nifty in the below article.

Bank Nifty Daily chart with 54 Day’s Time cycle
Hurst Time cycle – On every 54th day, Bank Nifty has a tendency to move on the upside which can be seen in the above chart. For most of times prices have formed a low within the cycle zone post which we have seen a reversal on the upside.

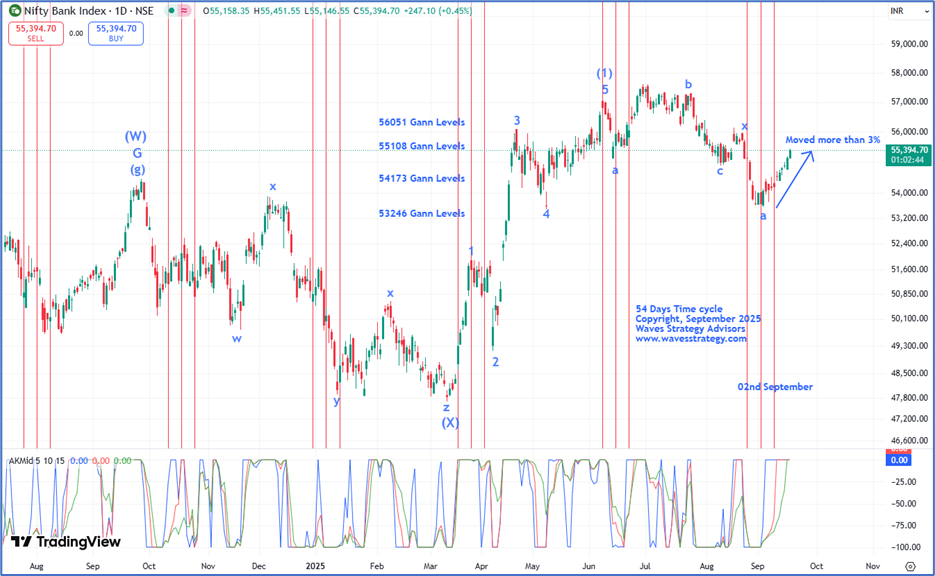
Recently at the start of September 2025, Bank Nifty formed short-term low near 53561 levels which was precisely within our cycle zone and post which prices reversed on the upside and surged by more than 1800 points which is a move of more than 3%This is the power of time trading!

As of now, for the 54 days cycle to turn on the buy side a decisive break above its previous swing high near 56000-56150 levels is must. On the downside, 53561 levels which is a cycle low should remain protected. Any breach below it will be a sign of concern.

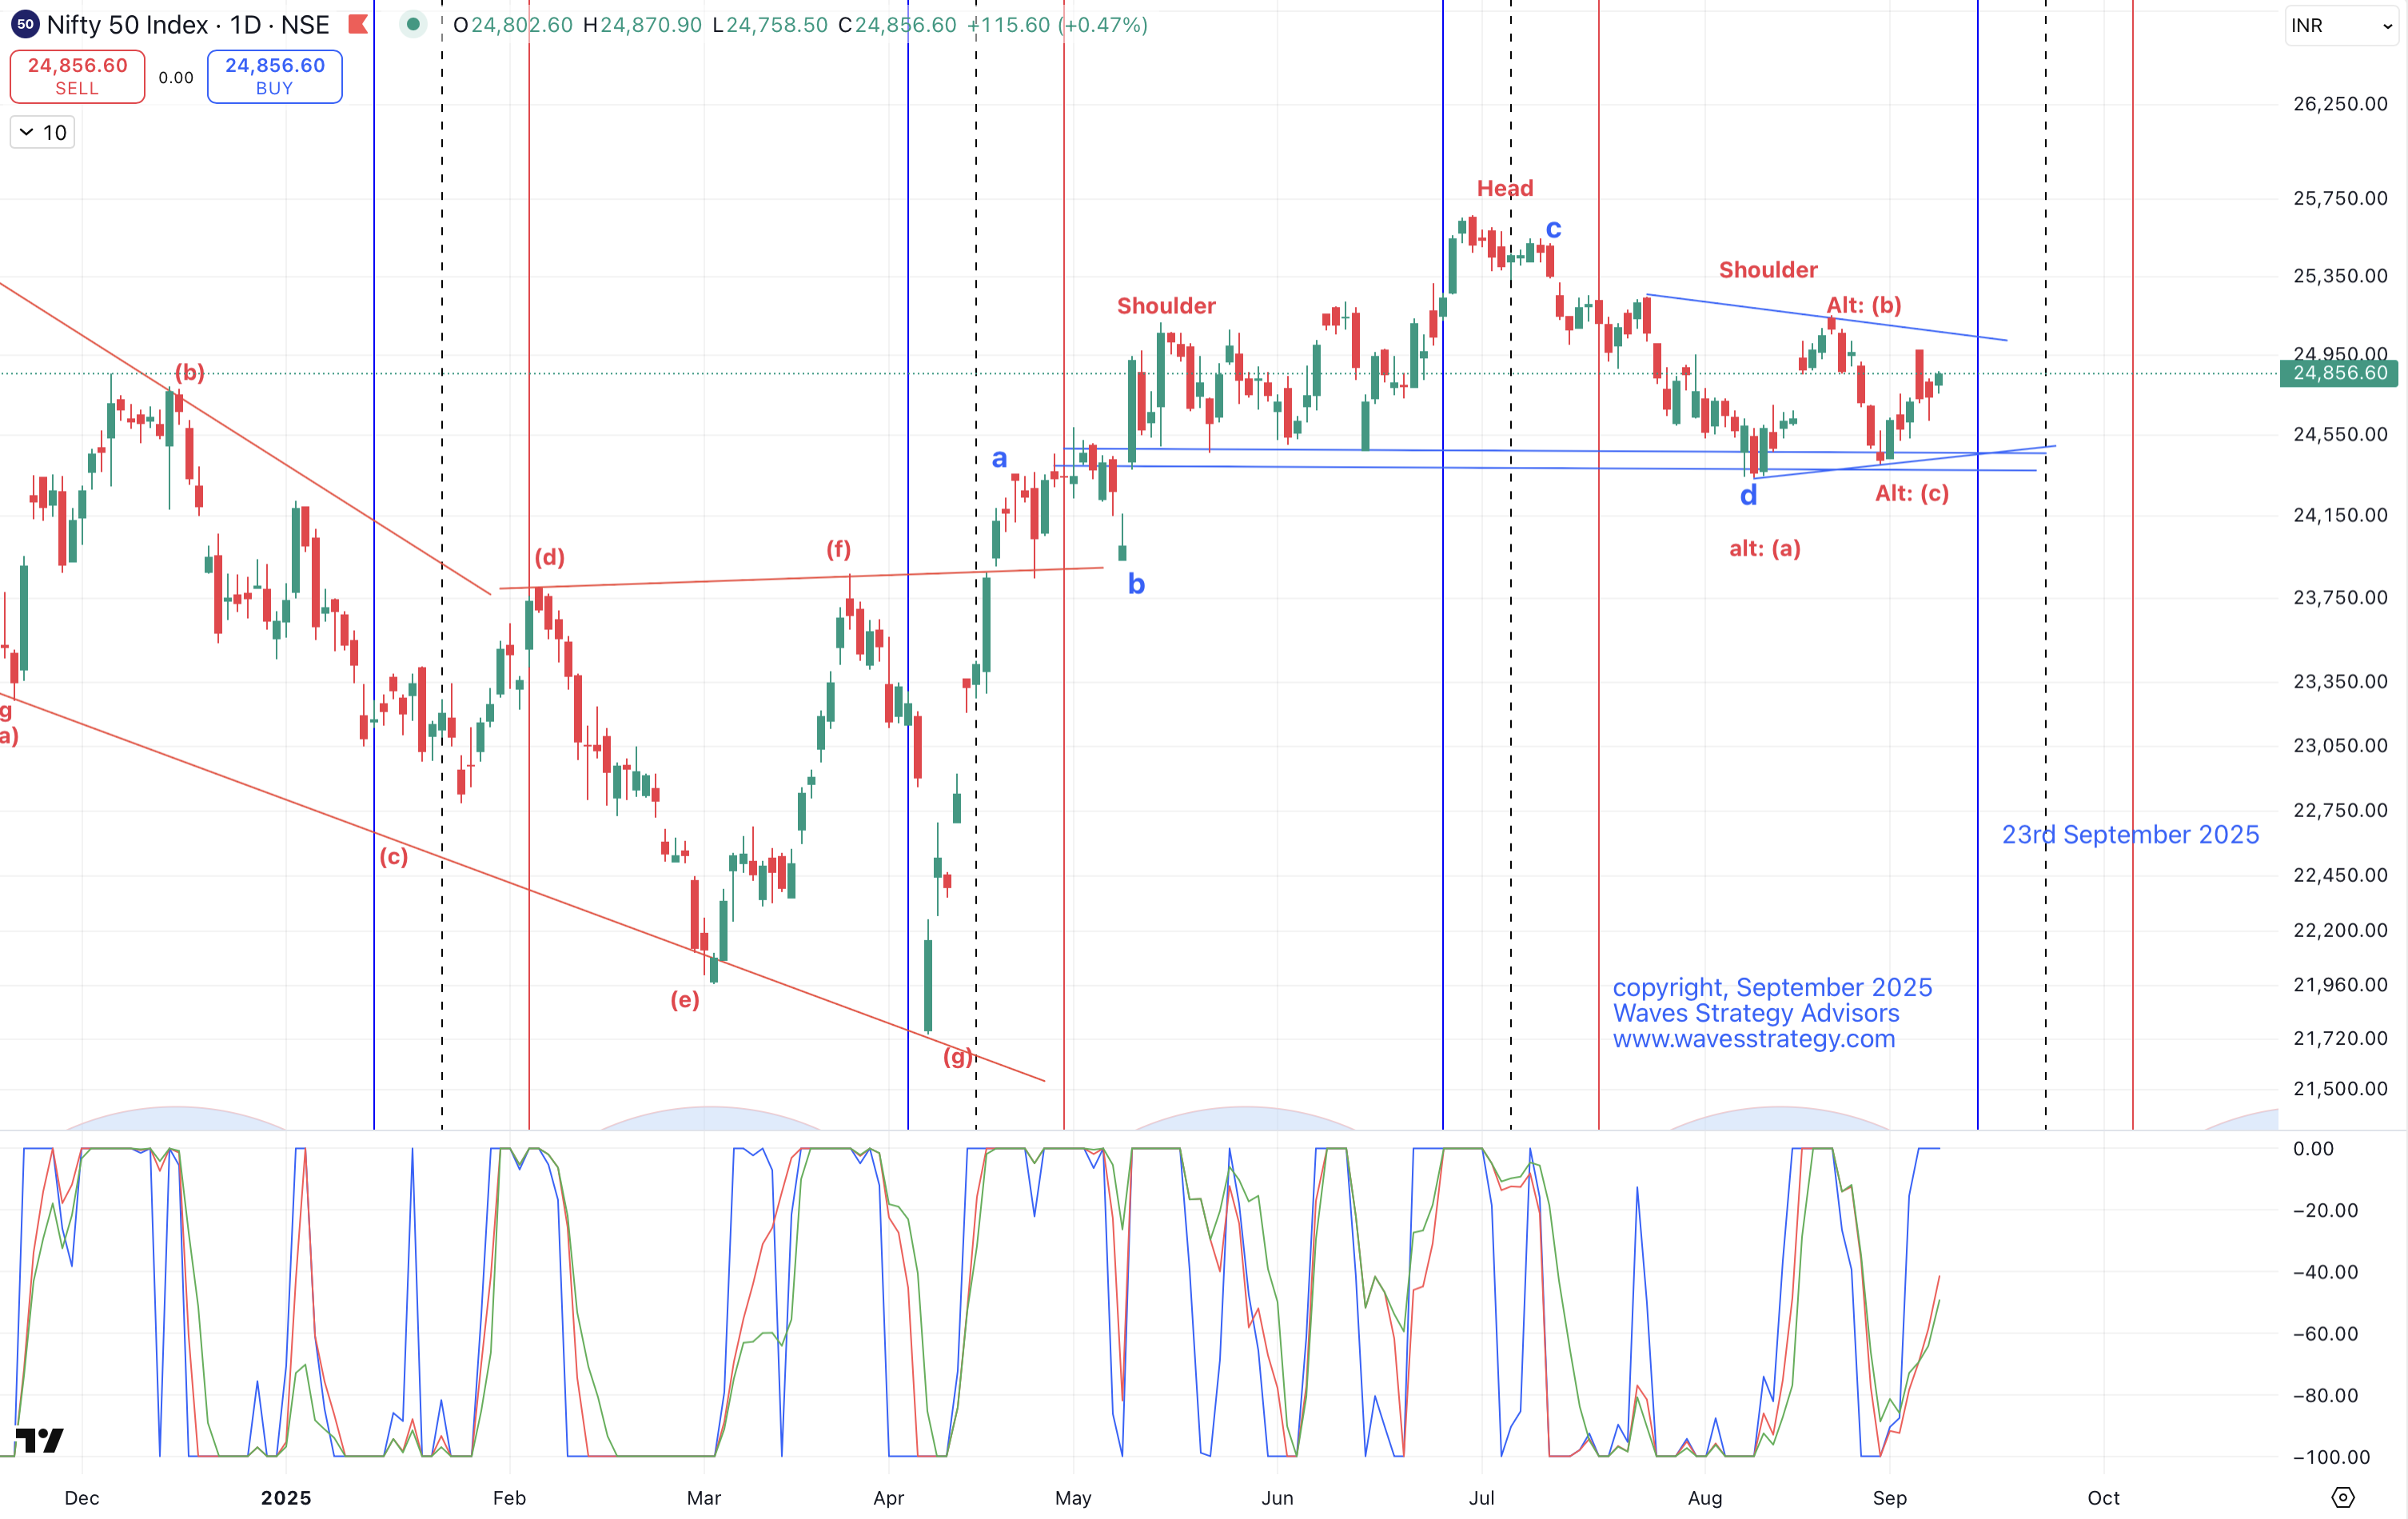
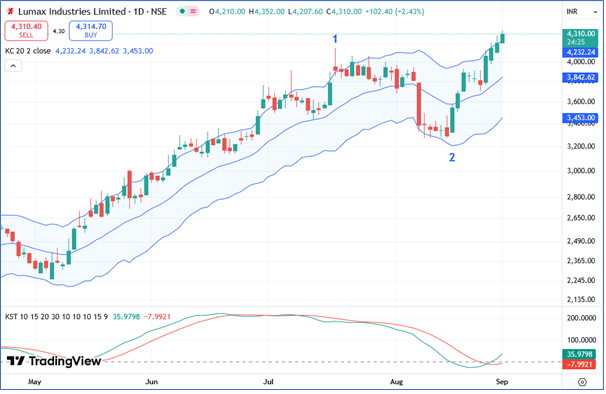
AK Indicator: The indicator below the price chart is a custom indicator made by me to identify potential reversals, trend of the index or stock and momentum. When all the 3 lines of this indicator is at the upper 0 line it represents strength in the trend and one should adopt buy on dips strategy unless the 3 lines deviates again.  We can see that these 3 lines touched back on the upside again post June 2025 suggesting that we have again entered into buy on dips market.

In nutshell, by combining this science of Time trading one need not worry about missing out the trend as if time is in favour, then one can predict moves well in advance.

For such Bank Nifty levels and strategic insights, join our Prithvi Membership where you get expert analysis and actionable levels. Click here

Brahmastra (Mentorship on Timing the market) –Over period of 3 months equip yourself with all the tools to trade the market with an edge of Time, application of Elliott wave & Neo wave to predict future movements, Options strategy, detail understanding about custom(AK) Indicator, stock selection scanner, Multibagger and Momentum stock identification technique, access to a private community group, Mentorship sessions for the complete trading journey. Know more here:

Monday, September 15, 2025

 Elliott wave when combined with Price action leads to interesting results. The following research is picked from Aakash monthly report of Previous August 2025 month. Stock is moving accordance to our path and is heading to our target of 1100 levels. See detail research below:

Jindal Steel Weekly chartMetal sector has been consistent in outperforming Nifty 50, generating greater alpha which highlights the strength in the ongoing sector thus making it attractive to the investors.

Safeguard Duty Policy Development - The Directorate General of Trade Remedies (DGTR) has recommended a three-year safeguard duty on certain categories of steel imports to protect the domestic industry from rising import pressures. This move is likely to benefit the Metal giants such as Tata Steel, JSW Steel, SAIL, and Jindal Steel & Power (JSPL), and may further reinforce the sector’s positive trajectory.

Jindal Steel and Power Ltd carries a weightage of 5.35% in the CNX Metal Index and is one of the top performers in the Index. The stock has been outshining its sector.

Weekly chart- As per the Dow Theory, prices have been moving in a higher high and higher low formation and has been moving in line with its upward sloping trendline which keeps the weekly trend on bullish side. Prices bounced from the 45 Period Exponential Moving Average towards the end of August 2025. So as long as same remains protected on the downside we can expect further rise to continue. Support as per this is at 940 levels.

 From the wave perspective, the entire rise in Covid low 2020 has been impulsive in nature. Wherein, intermediate wave 3 of Primary wave (3) got completed on the upside in July 2024 and post which the entire correction was in the form of Intermediate 4 which got completed in the form of a 7-legged Diametric pattern. The current rise is in form of wave 5 of (3).

In a nutshell, Technical IndicatorsPrice action and Elliott wave all are in tandem with each other which hints towards positive up move in the stock. One can continue to use buy on dips approach to ride the trend with the aim for fresh record highs. On the downside 940 levels should remain protected which is EMA (Exponential Moving Average) support.

For such more powerful and strategic insides about stocks and indices, subscribe to our Aakash monthly report

Brahmastra (Mentorship) on Timing the market – Equip yourself with tools of Elliott wave, Neo wave, Time cycle, stock selection algo creation, Multibagger and momentum stocks identification along with exact trade setup that actually works.  Know more here:

Wednesday, September 10, 2025

Missed Nifty’s Jump? Here’s the Exact Setup That Caught It

Time Cycles are a powerful tool in technical analysis that help traders identify potential market turning points. When Time analysis is combined with price action it helps traders to form efficient trade setup which helps to capture early reversals.

Below is the chart which shows a detailed path of Nifty which we anticipated in our Article dated on 04th September 2025.

Nifty 15 min chart: Anticipated as on 04th September 2025

Nifty 15 min chart: Happened as on 10th September 2025

Time cycles are fractal in nature which means it can be plotted and used across all time frames. For Nifty43 period of Time cycle works extremely well on the 15-min Time frame. When majority of the crowd was bearish side, we projected possible path ahead for the index in our past article dated on 04th September 2025.

As anticipated, prices formed a short-term low exactly on 05th September 2025, 12pm near 24620 levels and Bang on! We saw a pullback of more than 250 points on the upside. Furthermore, we anticipated next short term low formation on our cycle by 09th September 2025, 10.15 am and Nifty witnessed an exponential rise of more than 200 points from it. This is the power of Time trading!

In nutshell, by using science of Time cycle with price action one can stay ahead of the crowd as it can predict lows prior than it has already happened.

The next cycle is due today at 2:45 pm, one can look for buying opportunity near the same.

For such Nifty levels and strategic insights, join our Agni Membership where you get expert analysis and actionable levels.  Click here

Brahmastra (Mentorship of 3 months) on Timing the market – Learn to time the market to the very Day, Hour and Minute by combining the concepts of Hurst’s Time cycle on Index and stocks as well, Gann square of 9, Elliott wave, Neo wave and be a part of elite trader’s community who are Time Traders. Limited seats only, Early Bird offer Ends soon . Know more here:

Tuesday, September 9, 2025

Bank Nifty Trading using Elliott wave with Time cycles

Bank Nifty Elliott wave pattern along with Time can provide probable areas of reversal.

Elliott wave is GPS of the market that shows probable path that prices can follow. Time cycle helps to understand the area from where prices can probably reverse.

Bank Nifty daily chart:

Bank Nifty hourly chart:

Elliott wave analysis: Bank Nifty daily chart shows 54 days Time cycle that this index follows. Prices have been reversing on upside from this cycle zone. It has currently again come near the same area. However, we are yet to see positive price action. Break above 55550 will provide 1st confirmation that prices and time are in sync.

As per Elliott wave prices are moving in form of wave b after completing wave a at the lows. This indicates that the upside momentum can be slower and might not move beyond 56000 levels. The up move will be only wave b and there can be again a move on downside in form of wave c.

Pattern analysis is crucial aspect of Elliott wave. As per this prices can possibly form Triangle or Flat pattern. This is derived by looking at time cycle which is showing upside thrust over short term as long as 53560 is intact.

In a nutshell, Bank Nifty is at crucial juncture. Break above 55550 levels will bring price and time in sync for a move to 55200 or higher levels. Any breach below 53560 will be a sign of concern.

3 months of Mentorship (Brahmastra) on Timing the market – Equip yourself with methods and techniques of Time cycles with Elliott wave patterns that actually work, Mentorship starts soon with only limited seats. Learn to derive targets, stoploss and time it to the very Day, Hour, and Minute. Limited seats only.  Know more here:

Monday, September 8, 2025

Nifty Diametric Neowave Pattern with 55 Days Time cycle

 Nifty advanced Elliott wave – Neo wave pattern provide strong forecasting ability right from short to long term forecasting.

It is important to identify the pattern to trade profitably using good risk reward setup.

Nifty Neo wave daily chart
Elliott wave analysis – Nifty has been moving in a range since 4 months with prices awaiting a strong trigger. As per time cycle 23rs September 2025 is when we should see meaningful low and upside momentum can pick up. Time is dynamic and so 5 days of leeway is possible and se we have shown the range.

As per above chart, prices look to be forming triangle pattern within wave (e). Post completion of this pattern we can see a strong trend move probably on downside but it is important to get price confirmation below 24620 levels.

Alternate possibility – A smart trader is always aware about the lower probable scenarios in case of adverse movement. As per this the entire wave d can form triangle pattern itself as shown by alternate counts. This is a strong bullish scenario and will be preferred on break above 25100 levels.

AK custom indicator – is shown below the chart which highlights non trending behaviour as all the 3 lines are separated. We have been talking about it since weeks that as per this indicator Nifty is in non trending range and scalping is the best strategy until all 3 lines connect back together again!

In a nutshell, we might still have a week of consolidation as per Time cycle and 24620 – 25100 is the range. Break of these levels will provide strong forecasting ability to capture the next trending move.

Brahmastra (Mentorship) on Timing the market – 3 months of Mentorship can transform you as a trader who is looking forward to learn the systematic science of trading using Time cycles, Elliott wave, Neo wave, stock selection algos, Risk management. Only a few seats left, Know more here:

Thursday, September 4, 2025

Nifty Scalping Strategy Using 15 Mins chart with Time cycles & Neo Wave Pattern


Nifty-Elliott-Wave

Nifty had been following the Time cycles extremely well and it is a very powerful tool to apply if only you know how to use it.

Trading successfully and profitably is easy only if you have the right tools and know when not to trade. Also, cutting the losses short and letting profits run is utmost important.

Nifty Time cycles on intraday chart and Elliott wave patterns is a very powerful combination.

Nifty 15 mins time cycle with Neo wave

Elliott Wave analysis: Above chart shows that prices have been following the Time cycles extremely well even on the 15 minutes chart. This indicates that every specific time period prices turn on the upside. For detailed periodicity and approach we will be mentioning it in our daily morning research report. We have been aware that if the conviction is correct but the timing is off even by an hour the trade can turn into a non – profitable one. So timing the trade is utmost important. Along with that it is also crucial to know which pattern the markets are forming. From Time cycles in case of downtrend we see pullbacks, in case of uptrend from time cycle zone we get classic buying opportunity.

Neo wave analysis suggests that the rise from the lows of around 11600 has been in the form of double corrective and prices are moving now in the form of wave e of the second corrective pattern. It is highly probable that this pattern can be a Neutral triangle pattern. However, only a break of important levels along with time cycle confirmation will provide us with a trade setup. Time cycle low is approaching and it will be crucial to see how prices behave hereon.

In above chart, we have shown probable path Nifty can follow on basis of Time cycles and Neo wave. Price action confirmation above 24860 will confirm start of wave e higher and completion of wave d at the lows. Wave e can travel equal to wave c.

In a nutshell, Time cycles with Elliott wave can not only assist from bigger time frame perspective but also from short term trading opportunities right from tick charts to 15 minutes time frame. Astonished yet! Apply to see it and get thrilled how precisely everything works.

3 months of Mentorship (Brahmastra) on Timing the market – Equip yourself with methods and techniques of Time cycles with Elliott wave patterns that actually work, Mentorship starts soon with only limited seats. Learn to derive targets, stoploss and time it to the very Day, Hour, and Minute. Limited seats only. Know more here:

Nifty Topping Head & Shoulder Pattern, Time to be ALERT!

 Nifty is showing technical analysis pattern of topping Head & Shoulder. Prices have tested the support zone of 24337  24420 multiple times and bounced from there.

Will Nifty Crash from here?

If 24337 is taken out we can expect sharp move on downside is plausible.

Elliott wave analysis – Nifty has been struggling to move up and prices are giving away all the gains it made in month of August.

We can see topping H&S pattern which will become active if the support near 24420 followed by 24337 is broken on downside. This gives conservative target of right shoulder projected down to 23620 and aggressive target of Head projected on downside near 23250 levels.

Do note that this pattern will become active only on breach below the neckline support.

As per Neo wave prices might have completed wave e of Extracting triangle and can move lower until 23rd September 2025 as per Hurst’s Time cycle as well.

Advanced methods of technical analysis that helps in forecasting is now in sync with orthodox technical analysis method. This view will remain valid unless prices move back above the right shoulder near 25100 – 25200 levels.

AK Indicator – This indicator is made by me and helps to understand strength of the trend. As of now all the 3 lines are deviated which suggests the trend is weak in either direction. Once all the 3 lines are joined together on downside a strong move or trend can be expected.

In a nutshell, by combining simple methods of price action pattern along with forecasting tools of Neo wave, Time cycles it is plausible to forecast market with an edge of time. This is science of probability and works even on short term scalping to long term investment perspective.

3 months of Brahmastra (Mentorship) on Market Timing – Trading requires right set of psychology, Options & stock market timing tools Hurst’s Time cyclesElliott wave, Neowave techniques. 3 months of Brahmastra (Mentorship) with handholding on this life transformation journey. Know more here:

Monday, September 1, 2025

Lumax Industries path ahead using Advanced Elliott wave!

 When we combine Elliott wave along with technical indicators like Keltner channel® and KST, it helps to form powerful setups with accuracy. Witness the magic of Wave theory along with simple Indicators and check out how Lumax Industries Ltd has been moving precisely as per the counts.

See the detailed research below on Lumax Industries Ltd

Lumax Industries Ltd Daily Chart with Elliott wave
Lumax Industries Ltd recently broke above its consolidation range of 3705 to 3930 levels and has extended its gains since. Stock is continuously making fresh highs since past 3 days which highlights strength in the ongoing trend. Along with this, prices have already given a breakout of the upper boundary of the Keltner channel which is a positive sign. Moreover, we have applied KST (know sure thing) to gauge the overall momentum in the stock. Wherein KST line has recently turned above signal line and have turned above zero line as well which can further accelerate bullish momentum in the stock.

The stock is following classic Elliott wave theory. The rise since April 2025 has been in impulse in nature. Wherein, wave 2 got completed on the downside in the August 2025 and the current rise looks to be unfolding in the form of Primary wave 3. Usually wave 3 is considered as the strongest wave as per guidelines.

In a nutshell, we can conclude by saying that when Price and Elliott wave are in sync it can lead to interesting results even in stocks one c an easily forecast probable path.  For now, one can continue to use dips as a buying opportunity with 4050 levels as the important support level.

Brahmastra (Mentorship on Timing the market) – Over period of 3 months equip yourself with all the tools to trade the market with an edge of Time, application of Elliott wave & Neo wave to predict future movements, Options strategy, access to a private community group, stock selection scanner, Multibagger and Momentum stock identification technique. Mentorship sessions for the complete trading journey.  Fill the form below for more details: Know more here: