Thursday, July 31, 2025

Is it Possible to catch early Reversals in Gold?

 It is fascinating to see how accurately Time cycles can predict early reversals on the Gold, the same way as stocks or indices.

Time Cycles is an advanced Technical Analysis study which helps traders to stay ahead of the crowd. It is simply amazing to see how easy Trading becomes if one is aware about such reversal time areas with exact date to the very minute.

MCX Gold Daily chart as on 31st July 2025
We used the concepts of Hurst’s Time Cycles and found actual cycles working on Gold prices. It is amazing to see how fractal nature of Time cycles can help us catch reversals on every time frame.

We can see that all the major lows formed on Gold is near 51 days Time cycle including the recent low of 94950 levels formed in tandem with our Time cycle low which due on 30th June 2025. Post which, we have seen an exponential rise of more than 5500 points in GoldThis is the power of Time trading!

As of now, the cycle has already turned on the buy side and the medium-term outlook is still positive. As of now, we expect Time support of 94950 to remain protected on the downside until the next cycle is due which is on 10th September 2025.

Brahmastra (Mentorship on Timing the market) – Over period of 3 months Equip yourself with all the tools to trade the market with an edge of Time on Equity and Commodity markets as wellElliott wave, Neo waveOptions strategy, access to a private community groupstock selection scannerMultibagger and Momentum stock identification technique, Mentorship sessions for the complete trading journey, Know more here

Wednesday, July 30, 2025

Sunpharma at a Turning Point? Time Cycle Reveals Surprising Buy Signal!

 Time Cycle is an advanced tool and it is surprising that such concepts help to be ahead of the majority crowd and catch lows in advance which improves decision making of the traders.

It is fascinating to see how accurately Time cycles can predict early reversals on the stock and in the same way as Indices.

J.M. Hurst defined that there are standard cycles that exists and it is possible to identify the actual cycles in stock, Indices and even on commodities.

SUNPHARMA Ltd Daily chart with 130 Days’ Time Cycle:
Time Cycle – Every stock or Index has its own Time cycle horizon. In the above daily chart, we have applied 130 period Time Cycle on the Daily chart which has been successful in capturing major lows from time to time from which we have seen a reversal on the upside. This is the power of Time trading!

On the daily timeframe, Sunpharma Ltd has been moving in a higher highs and higher low structure within its multiyear upward slopping channel. Recently, prices formed a short-term low of 1635 levels near our Time cycle which was due on 23rd June 2025. As of now, cycle has already turned on the buy side by breaking above its previous swing high i.e. near 1730 levels. For ow, we can expect good momentum to build up in coming sessions as long as 1635 levels which is the Time support remains protected on the downside.

In a nutshell, Sunpharma Ltd has already turned on the buy side. Follow up buying is needed for a fresh rally to resume on the upside. On the downside, 1635 levels is the nearest support for the stock.

Want to know more about such stocks on the mark! subscribe to our Vayu Short-Term Update: Get a list of stocks with high growth potential: Check Here

Brahmastra (Mentorship) on Timing the market – Equip yourself with tools of Elliott wave, Neo wave, Time cycle, stock selection algo creation, Multibagger and momentum stocks identification with exact trade setup that actually works. Also, get exclusive access of AK Indicator for 3 months, Know more here

Monday, July 28, 2025

Paytm Signals a Buy Again – AK Indicator Nails It Repeatedly!

 Customised AK Indicator created by Mr. Ashish Kyal specialises in identifying trend signals which helps to catch momentum early so that it can fetch maximum gains in minimum time post the signal.

Nifty and stocks trading can be at a different level if you use this one indicator, it gives trend, direction, entry, exit built all in one.

Paytm Daily chart as on 28th July 2025
Paytm 15 Mins chart as on 28th July 2025
Customised AK Indicator

This indicator shows that during uptrend the green line is at 0 level and other blue and red line deviates whereas during downtrend all three lines converge on downside near -100 levels. This indicator consists of 3 trend lines. When all the lines merge together near the 0 line it suggests that bullish momentum is likely to buildup in the underlying.  If daily trend is on the upside, one should refer to 15 mins chart for entry and exit signals. One can see that how it has worked precisely on the above charts.

We can see that on the daily timeframe on 11th July 2025, all the 3 lines merged together near the 0 line which suggest that the trend is now on the buy side. Further, on the second chart, we got multiple entry points to ride the ongoing uptrend and in this stock this setup has been able to capture on an average 6-8% move on each signal.

In today’ session, we have got another buy signal on the 15 mins chart in first hour itself. So, one can continue to look for similar buying opportunity on 15 mins chart as long as daily trend remains on the upside as per the AK Indicator.

One can test this advance customised AK Indicator and can witness its magic on Index and stocks as well! Know more here

Brahmastra (Mentorship) on Timing the market – Equip yourself with tools of Elliott waveNeo wave, Time cycle, stock selection algo creationMultibagger and momentum stocks identification with exact trade setup that actually works. Also, get exclusive access of AK Indicator for 3 months. Know more here

Wednesday, July 23, 2025

Want to Catch the Next Eternal Ltd Move? Learn How We Did This

 Elliott wave when combined with Price action leads to interesting results. By using Time cycle and wave theory together it can help predict capture reversals way before it has happened.

New traders want to trade and capture every moves & on other hand seasoned ones know the real money lies in sitting tight and try to capture the best of the 3rd wave.

See the detailed analysis on Eternal Ltd that we published in our Aakash monthly report on 22nd April 2025.

Eternal Ltd Weekly chart with Time Cycle: Anticipated as on 22nd April 2025
Eternal Ltd Daily chart with Wave Theory: Anticipated as on 22nd April 2025
Anticipated wave Analysis as on 22nd April 2025

Eternal Ltd is the newest entrant in Nifty 50. The stock has been moving within a multiyear channel since July 2022 signifying strong trend in the stock. Now let’s understand the view for Eternal with the help of advanced technical tools.

The stock is following classic Elliott wave theory. Wherein, Primary wave (1) recently got completed on the upside in September 2024 and since the entire fall has been unfolding in the form of wave (2) which is further subdividing in nature. Wherein, it looks to be unfolding in the form of an irregular flat pattern (3-3-5) as wave b has retraced more than 100% of wave a. For now, a decisive break above 245 levels can confirm completion of wave (2) on the downside. Then the rise would be in the form of primary wave (3). As per the Elliott wave guidelines, it is considered to be the strongest wave.

Weekly chart- Prices recently found support of its multiyear channel and reversed on the upside which is positive sign. In the previous week, price has closed above prior candle’s high which is giving us hints about possible trend change on the sides of bulls. However, for confirmation acceptance above 246 is must. Also, prices have retraced more than 38.2% of the prior fall and now with follow up buying we can expect prices to retrace minimum to 61.8% i.e. 259 levels.

On the daily chart, we have applied Bollinger bands® to gauge price action and volatility in the stock. Since reversing from the lower Bollinger Bands® on April 7th, the stock has consistently protected its prior day's low on closing basis suggests that bulls are tightening their grip by each day passing. As prices have managed to complete its journey towards the upper bands which reinforces strength in the ongoing trend.

144 Weeks’ Time Cycle – Time cycles are another amazing technique which helps in capturing lows and highs from time to time. Every stock has its own Time cycle and here on the Weekly chart, we are showing 144 Weeks’ Time cycle, it is really effective in capturing the major low points. Currently, prices have already entered into its cycle zone which was due on 1st April and has formed a short-term low near 194 levels. For now, we expect prices to break above 245 levels can confirm that cycle has turned on the buy side.

In a nutshell, the current trend for Eternal looks to be bullish. A break above 245 levels is must for bullish momentum to continue which can lift the prices higher towards 285 and eventually to 320 levels. On the downside, a break below 210 levels which is a channel support will be a sign of trend change.

Eternal Ltd Daily Chart: Happened as on 23rd July 2025
Happened as on 23rd July 2025

In our monthly report, we expected Eternal Ltd to show an impulse rise as we anticipated wave 3 of Primary wave to start on the upside which is considered as the most trending wave as per the guidelines. On 21st July 2025, the company announced better than expected quarterly results which pushed prices towards its lifetime high of 311 levels.

Prices broke above 245 levels and saw an exponential rise of nearly 27% since. This helped prices to surge through our target 1 of 285 levels and nearly achieved our target 2 of 320 levels. We were able to predict this rise before it actually happened using Time cycle, Wave theory and Price action.

Brahmastra (Mentorship) on Timing the market – Equip yourself with tools of Elliott waveNeo wave, Time cycle, stock selection algo creation, Multibagger and momentum stocks identification along with exact trade setup that actually works. Fill below form for more details. KNOW MORE HERE

Monday, July 21, 2025

Bank Nifty's 89-Cycle Delivers Big Again – 350 Points in One Day!

 Time Cycles are a powerful tool in technical analysis that help traders identify potential market turning points. When Time analysis is combined with price action it helps traders to form efficient trade setup which helps to capture early reversals.

Below is the chart which shows a detailed path of Bank Nifty which we discussed in our past weekly webinar held on 19th July 2025 with 1000’s of participants.

Bank Nifty 15 min chart: Anticipated as on 19th July 2025
Bank Nifty 15 min chart: Happened as on 21st July 2025.
Time cycle are fractal in nature which means it can be plotted and used across all time frames. For Bank Nifty, 89 period of Time cycle works extremely well on the 15-min Time frame. When majority of the crowd was bearish side, we projected a up move in the Index in front of the 1000’s of participants.

As anticipated, we expected prices to form a short-term low near our cycle zone which was due on 18th July 2025 at 11:45 AM post which we saw a pullback on the upside and BANG ON!! Prices managed to protect its Time support of 56200 levels on the downside and post breaking its previous swing high of 56435 levels, prices saw an exponential gain of more than 350 points in a single day! This is the power to Time trading!

In nutshellby using science of Time cycle with price action one can stay ahead of the crowd as it can predict lows prior than it has already happened.

For such Bank Nifty levels and strategic insights, join our Prithvi Membership where you get expert analysis and actionable levels. Click here.

Brahmastra (Mentorship) on Timing the market – Equip yourself with tools of Elliott wave, Neo wave, Time cycle, stock selection algo creation, Multibagger and momentum stocks identification along with exact trade setup that actually works. Know more here

Thursday, July 17, 2025

Time Cycle Alert: Hero MotoCorp May Be Gearing Up for a Bullish Breakout?

Time Cycle is an advanced tool and it is surprising that such concepts helps to be ahead of the majority crowd and catch lows in advance which improves decision making of the traders.

J.M. Hurst defined that there are standard cycles that exists and it is possible to identify the actual cycles in stock, index and even on commodities.

Hero Motocorp Ltd Daily chart with 156 Days’ Time Cycle.
It is fascinating to see how accurately Time cycles can predict early reversals on stocks, in the same way as Indices.

Time Cycle – Every stock or Index has its own Time cycle horizon. In the above daily chart, we have applied 156 period which has been successful in capturing major lows from time to time from which we have seen a reversal on the upside. The recent cycle was due on 28th March 2025 and cycle has already turned on the buy side. For now, a decisive break above 4486 levels is required which can result into a fresh course of rally on the upside. The next cycle is due on 17th November 2025. By then, the recent cycle low of 3344 levels should remain protected on the downside.

In a nutshell, Hero Motocorp is at an important juncture. A decisive break above 4486 levels is must for further bullish momentum to continue. On the downside, 4150 levels is the nearest support for the stock.

Want to know more about such stocks on the mark! subscribe to our Vayu Short-Term Update: Get a list of stocks with high growth potential: Check Here

Brahmastra (Mentorship) on Timing the market – Equip yourself with tools of Elliott wave, Neo wave, Time cycle, stock selection algo creation, Multibagger and momentum stocks identification along with exact trade setup that actually works. Know more here

Tuesday, July 15, 2025

Bank Nifty's Perfect Timing – Don't Miss the Next Date!

 It is fascinating to see how accurately Time cycles can predict early reversals on the Nifty Bank Index, in the same way as stocks.

Is it possible to Time the Index? Can we use methods to predict when Index prices will reverse with the exact date and time? See below detail research about it.

Bank Nifty 15 mins chart with 89 period Time cycle as on 15th July 2025
Time cycle works well to catch early reversals even on shorter time frames like, 15 mins, 5 mins. For Bank Nifty, 89 period Time Cycle works extremely well on 15 minutes time frame. We can observe how every dip towards the cycle has given us a classic buying opportunity in the index.

The recent cycle for Bank Nifty was due on 14th July 2025 at 02:30 PM and prices have made low exactly near our cycle zone near 56600 levels, post which prices broke above the previous swing high level of 56730 and we saw a sharp rise of nearly 400 points on the upside. For now, Time Cycle has turned on the buy side. The next cycle is due on 18th July 2025 at 11:45 AM. Until then, recent cycle low of 56600 levels should remain protected on the downside.

In nutshell, by combining this science of Time trading one need not worry about missing out the trend as if time is in favour, then one can predict moves well in advance.

For such Bank Nifty levels and strategic insights, join our Prithvi Membership where you get expert analysis and actionable levels. Click here.

Brahmastra (Mentorship) on Timing the market – Equip yourself with tools of Elliott wave, Neo wave, Time cycle, stock selection algo creation, Multibagger and momentum stocks identification along with exact trade setup that actually works. Know more here

Monday, July 14, 2025

23rd July – Mark the Date! PAYTM’s Time Cycle Points to the Next Big Move

 Is it possible to Time the market? Can we use methods that can predict when will prices reverse with exact date and time even on stocks?

Time Cycle is an advanced Technical Analysis study and it is surprising that such concepts can help to time the market and catch early reversals which improves decision making of the traders.

PAYTM Daily chart with 57 Days’ Time Cycle as on 14th July 2025
J.M. Hurst is known as the father of Time Cycles. He identified that there are a set of standard cycles that work across markets. We need to identify the time cycle working on particular stock or index. However, Time trading needs to be combined with price action for precise entry. It is also possible to derive price targets using the Time concept.

We can see how 57-Days’ Time cycle has worked wonderfully on this stock. Most of the time near from the cycle zone we have seen a bounce on the upside. The recent low was also captured by our cycle near 807 levels and since then we have seen a rise of more than 20%. For now, next date and time to track is on 23rd July 2025. Around this time one can see the pattern and price action and if favourable can pull the trigger to capture another move in PAYTM on the upside.

In nutshell, the medium-term trend for PAYTM is likely to remain on the positive side. One should look for buying opportunity near cycle zone i.e. 23rd July 2025 to enter into a fresh long position.

Want to know more about such stocks on the mark! subscribe to our Vayu Short-Term Update: Get a list of stocks with high growth potential: Check Here

Brahmastra (Mentorship) on Timing the market – Equip yourself with tools of Elliott wave, Neo wave, Time cycle, stock selection algo creation, Multibagger and momentum stocks identification along with exact trade setup that actually works. Know more here

Wednesday, July 9, 2025

Elliott Wave vs Neo Wave: Practical Nifty Application

 Neo wave is an Advanced Elliott wave method with a greater number of rules and newer patterns to increase the overall objectivity. Whereas Elliott wave which was originally discovered by R. N. Elliott in 1930s. His original work mentioned that stock market does not move randomly but in systematic fashion. This systematic movement in prices are in form of waves. Normally there are 5 steps forward and 3 steps backward resulting into a net progression which is valid for stock market as well.

Any price movement as per basic Elliott wave is classified into Impulsive and Corrective. There are various patterns within these broader heads. Impulsive waves need to follow three basic rules:

1: Wave 2 cannot retrace complete of wave 1

2: Wave 3 cannot be the shortest of the directional waves 1, 3 and 5

3: Wave 4 cannot enter into territory of wave 1

The above 3 basic rules if followed then the price movement under consideration can be classified as a normal Impulse wave. However, when the market structure is complex there is possibility that the movement can be counted in many different ways. This can result into subjectivity and the entire purpose of wave theory can be lost. To overcome this limitation Neo wave was developed that has more than 15 different rules to define a simple impulse pattern. Following are a few of them:

1: Wave 2 cannot retrace more than 61.8% of wave 1

2: Wave 3 cannot be the shortest of the directional waves 1,3 and 5

3: Wave 4 cannot enter into territory of wave 2

4: There has to be at least one extended wave which is going to be 1.618% of non-extended wave. If there is no extension then the pattern under consideration is corrective

5: One of the directional waves should subdivide

6: Corrective waves should consume more time than the preceding impulsive wave

7: Touch point rule: Out of 6 points not more than 4 points should lie on the channel

8: …….

9: …. etc

The above shows only a few sets of rules for an impulse pattern as defined by Neo wave. I will be discussing all the rules more in detail in Sutra of Waves Online training happening on 12-13th July 2025.

–   Diametric Pattern

–   Neutral Triangle

–   Extracting Triangle

These new patterns are equally important to understand because majority of the movement seen in the world equity markets are taking the forms of these patterns that were never covered in original work of R. N. Elliott.
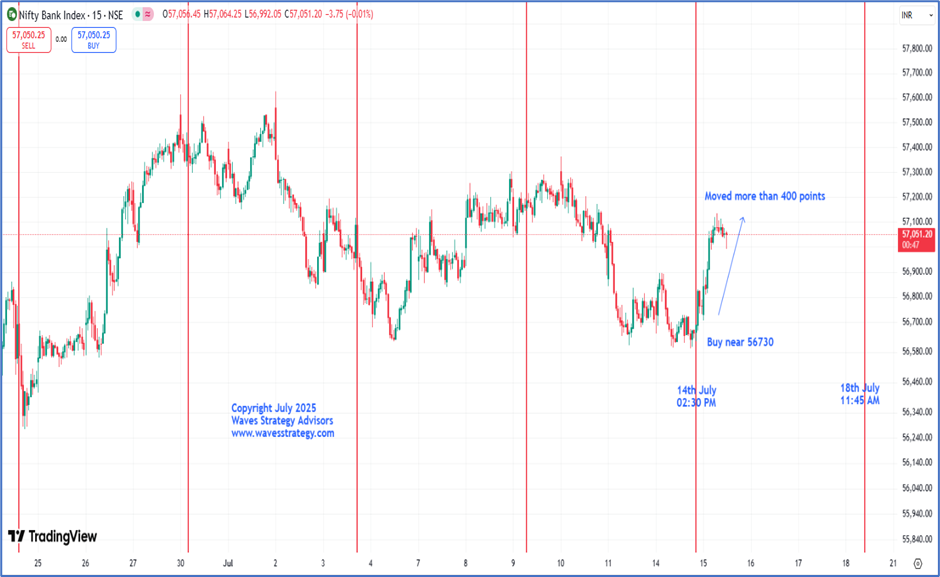
Nifty Hourly Chart:
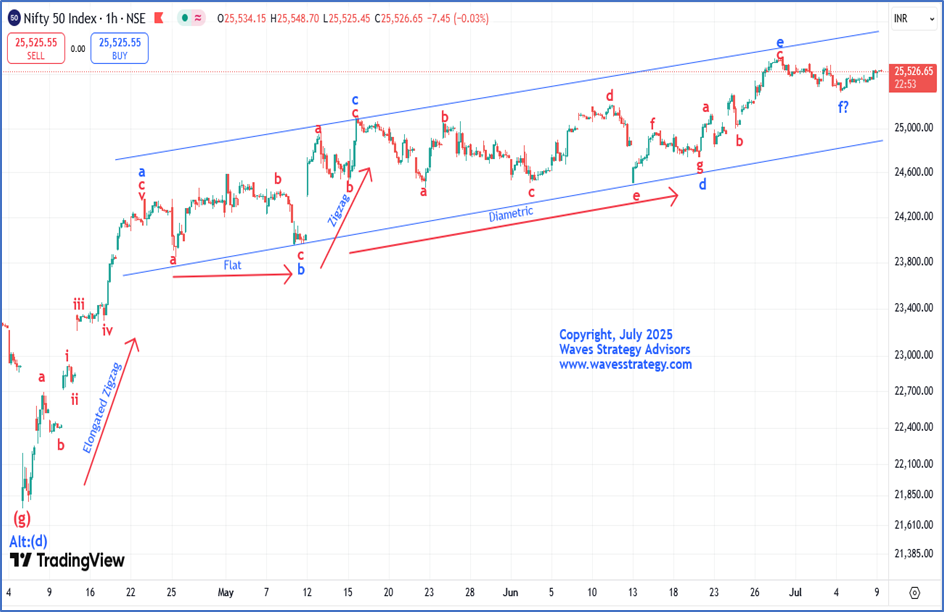
Neo wave chart shown above clearly shows different pattern combined together to form a complete price movement. Predicting this pattern helps to be in the right side of the trend. 

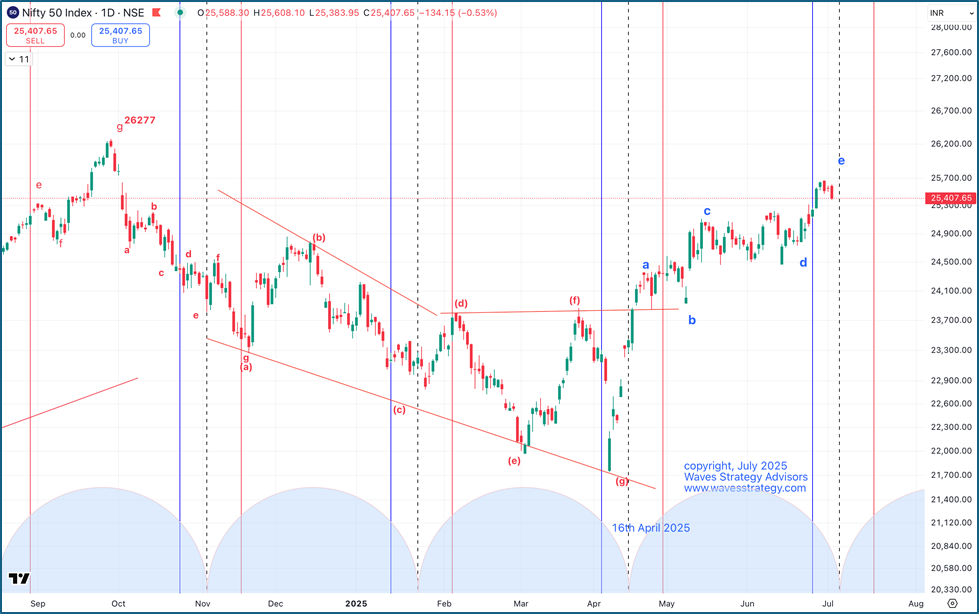
Post completion of Primary wave (d) on the downside, the entire move has been corrective in nature. Wherein, we have witnessed different kinds of corrective patterns like Elongated zigzag (5-3-5), Flat (3-3-5), Zigzag (5-3-5) and Diametric pattern (3-3-3-3-3-3-3). The above chart shows practical implication of different corrective pattern.

As one can observe that the Index moved exactly as per the Neo wave counts and wave e(blue) recently got completed on the upside in the form of a 7-legged Diametric pattern and post which the fall was in the form of wave f(blue). We are now expecting wave g higher to start as wave f has shown price and time wise equality as compared to wave b because as per the guideline wave b tends to equal to wave f.  For now, a break above 25670 levels can confirm completion of wave f(blue) on the downside and post which the rise can be in the form of wave g(blue).

In a nutshell, one can use this one powerful method – Neo wave for taking such bold trades & riding against the majority when no one expected it. Thrilled Yet!

Sutra of Waves (SOW) – Elliott wave has a few rules making it subjective at times but Neo wave has more rules and newer patterns like complex correction, Diametric, extracting triangle, that makes trading a lot more objective. Combine this with price action and Fibonacci trading system and see the magic of systematic trading using this scientific approach of trading. Limited seats only, Live session on 12th – 13th July. You can enroll from here. Register here
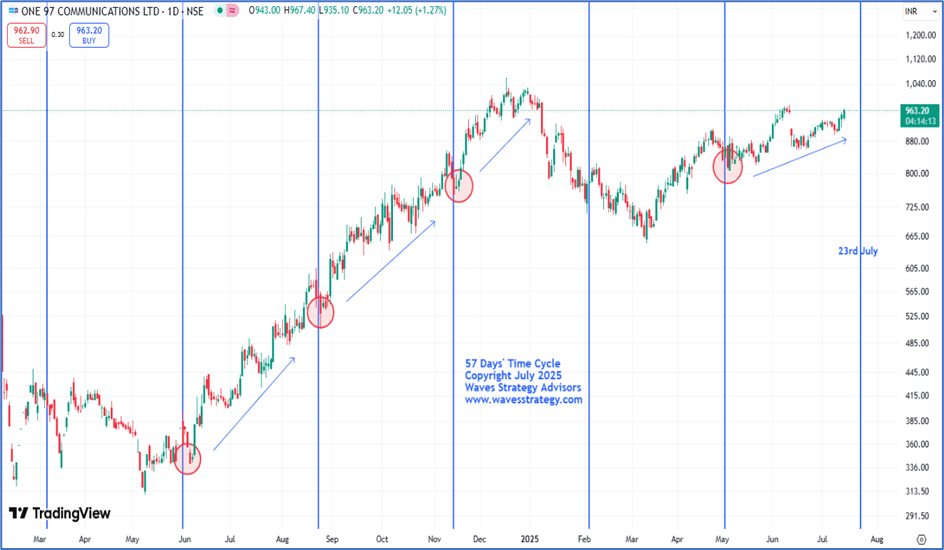
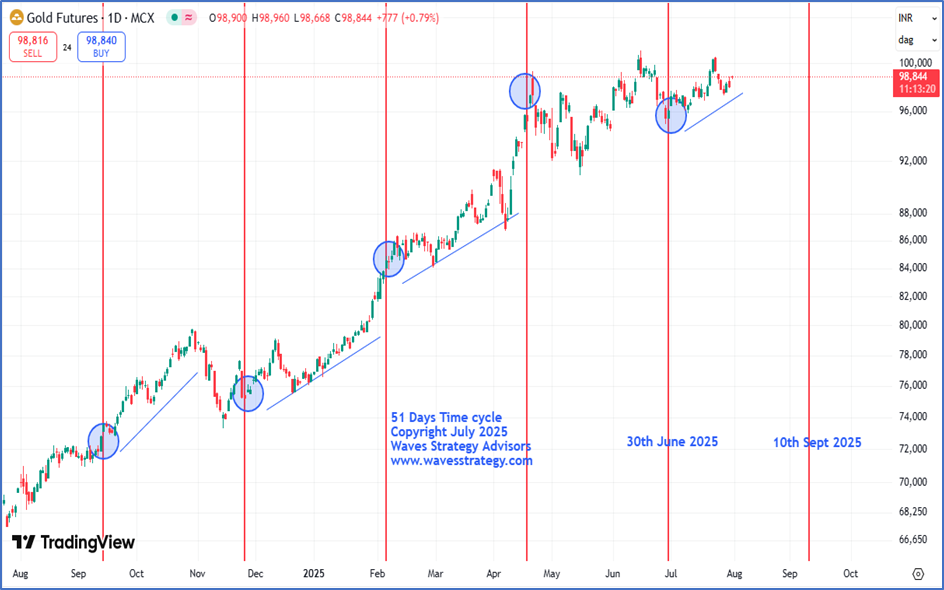
Monday, July 7, 2025

Britannia at a Turning Point? Time Cycles + Elliott Wave Reveal What’s Next!

 Elliott wave – Elliott wave along with Time cycle provides is classic combination for forecasting market right from short term to long term basis. Elliott wave is an advanced method that is used to predict price movements and overall help to understand maturity of the trend.

Britannia is moving in sync with our Elliott wave counts and following Time cycle precisely.

See the below research on Britannia Industries Ltd: -

Britannia Weekly Chart
On the above chart, we can see how our selected Time cycle of 52 Weeks has played out so perfectly. Time cycle has consistently captured all the recent lows before prices saw a sharp rise on the upside which can be seen clearly on the above chart. Recently prices formed a low in tandem with our Time cycle which was due on 17th March 2025. Post which, prices have witnessed a rise of more than 30%. This is the power of Time Trading! Also, the cycle has turned on the buy side after breaking its previous swing high of 5379 levels, so we expect this trending move to continue in the stock.

Along with this, we can observe, Britannia have been moving in sync with the Elliott wave counts. Recently wave (4) of Primary degree got completed on the downside in March 2025 which was in tandem with our plotted time cycle low. Post which, the rise has been unfolding in the form of wave (5) which usually tends to equality with (1) as per the guidelines which leaves space for the prices to trend further.

In a nutshell, Britannia is on the bullish side. one can expect a move towards its previous swing high of 6469 levels or high. On the downside, 5270 levels is the crucial support for the stock.

Want to know more about such stocks on the mark! subscribe to our Vayu Short-Term Update: Get a list of stocks with high growth potential: Check Here

Sutra of Waves (SOW) – Elliott wave has a few rules making it subjective at times but Neo wave has more rules and newer patterns like complex correction, Diametric, extracting triangle, that makes trading a lot more objective. Combine this with price action and Fibonacci trading system and see the magic of systematic trading using this scientific approach of trading. Limited seats only, Live session on 12th – 13th JulyRegister here

Titan's Epic Move: Is Wave 3 Ready to Skyrocket?

 Advance Elliott wave is the GPS of the market that helps to understand the overall maturity of the trend.

Novices think of getting at exact lows and getting out at exact highs but expert traders try to capture the best of the 3rd wave and wait like an eagle for that exact moment to catch the prey most of the time.

Titan is about to start wave 3 on the upside. See the detail analysis on Titan below:

Titan Daily chart
As we can observe, Titan have been moving in sync with our wave counts. Post completion of intermediate wave 1 of primary wave (3) on the upside in January 2024, the entire correction has been in the form of wave 2 which got completed on the downside near the channel support in form of a double complex correction pattern (w-x-y-x-z). Further follow up buying is needed to confirm about the completion of wave 2 on the downside. Post which, the rise will be in the form of wave 3 which is considered to be the strongest wave as per the guidelines.

In nutshell, Overall undertone for Titan looks positive and with follow up buying upside move to fresh record high is expected. On the downside 3390 levels is the nearest support.  

So, we can conclude by saying that when Price and Advanced Elliott wave are in sync it can lead to interesting results even in stocks.

Want to know more about such stocks on the mark! subscribe to our Vayu Short-Term Update: Get a list of stocks with high growth potential: Check Here

Sutra of Waves (SOW) – Elliott wave has a few rules making it subjective at times but Neo wave has more rules and newer patterns like complex correction, Diametric, extracting triangle, that makes trading a lot more objective. Combine this with price action and Fibonacci trading system and see the magic of systematic trading using this scientific approach of trading. Limited seats only, Live session on 12th – 13th JulyRegister here

Nifty 55 Days Time Cycle with Neo wave

 Advanced Elliott wave – Neo wave along with Time cycle provides is classic combination for forecasting market right from short term to long term basis.

Nifty is following 55 Days time cycle where we can observe major lows being formed within the zone of blue and red lines with central black as an important cycle period.

Nifty Daily chart:Elliott wave analysis - We have constantly mentioned that prices have been climbing when it reversed on the upside from 22000 levels. When prices were consolidating in a zone near 24500, we had mentioned about upside move to 25500 levels. All the events got digested, and prices moved higher.

Over near term, we are seeing consolidation near the center Time cycle of 55 Days which is due on 4th July 2025. Do note that as it is daily time cycle there is possibility of some delay of 3 to 4 days. A positive close back above 25600 will provide strong price time confirmation that medium term trend on upside is resuming.

Neo wave perspective is suggesting that prices are in wave e. We are not ruling out that wave f has started and move below 25300 will confirm this. Either way post completion of the ongoing down move upside trend should resume possibly in form of wave g taking prices to 25800 and higher levels. Diametric is a 7 legged pattern which has wave e = wave c, wave f = wave b and wave g = wave a.

In a nutshell, Elliott wave is GPS of the market and it provides levels, exact trade strategy, complete plan for upcoming trend not only on daily time frame but even for intraday setups.

Sutra of Waves (SOW) – Elliott wave has a few rules making it subjective at times but Neo wave has more rules and newer patterns like Diametric, Extracting triangle, that makes trading a lot more objective. Combine this with Ichimoku Cloud and Fibonacci trading system and see the magic of systematic trading using this scientific approach of trading. Limited seats only, Live session on 12th – 13th JulyRegister here