Thursday, May 22, 2025

M&M path ahead using Advanced tools!

 Elliott wave when combined with price action leads to interesting results. By using time cycle and wave theory together it can help predict capture reversals way before it has happened. Mahindra and Mahindra is at an important juncture along with Time cycle ongoing.

Novices think of getting at exact lows and getting out at exact highs but expert traders try to capture the best of the 3rd wave and wait like an eagle for that exact moment to catch the prey most of the time.

See the detailed research below on Mahindra and Mahindra ltd

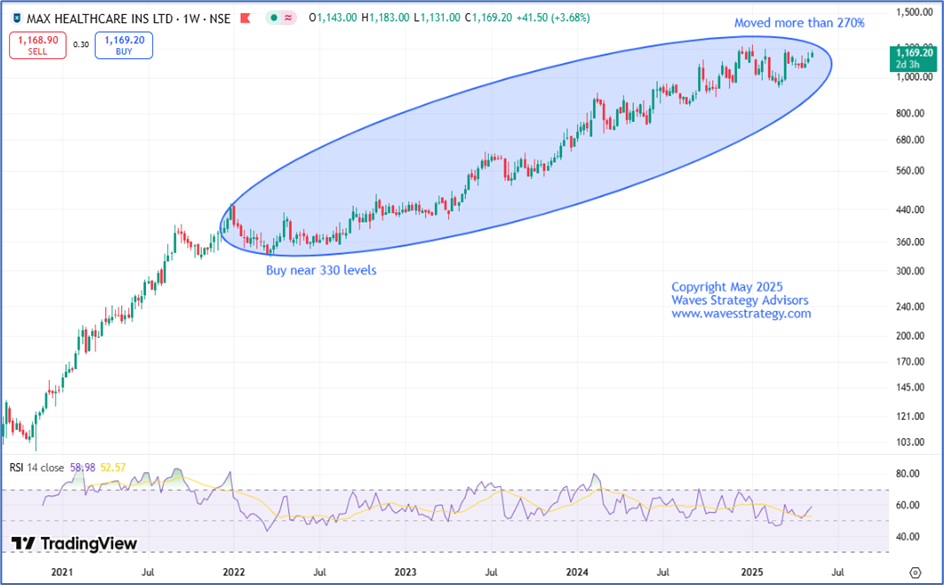
Mahindra and Mahindra Weekly Chart
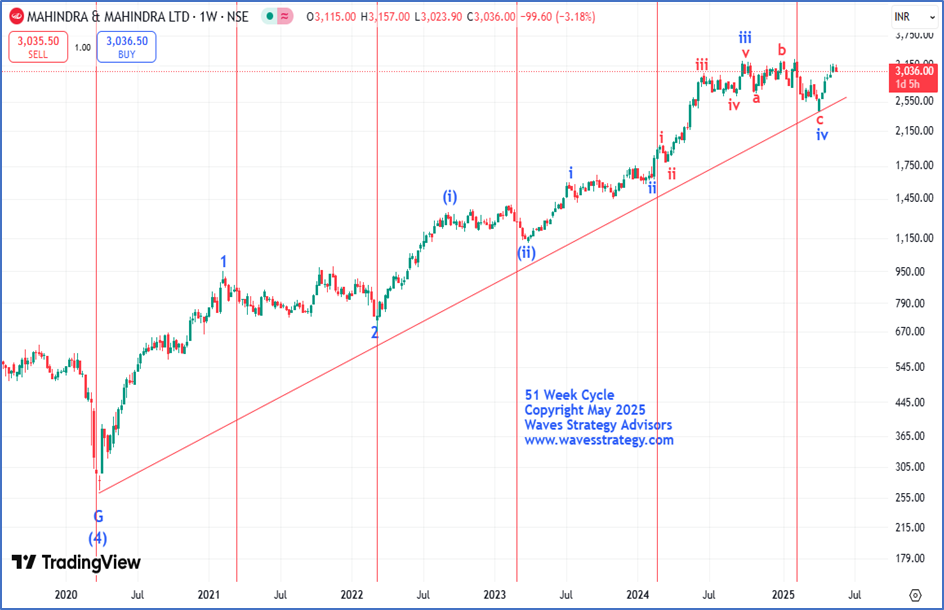
On the above chart, we can see how 51-weeks’ time cycle has worked out wonderfully. Time cycle has consistently managed to capture the major lows post which prices saw a reversal on the upside. Additionally, prices as of now have already entered into its cycle zone that was due on 10th Feb 2025. Currently, prices are trading near its previous swing high of 3270 levels, a decisive break above it can turn the cycle on the buy side and led to a trending move towards new fresh highs.

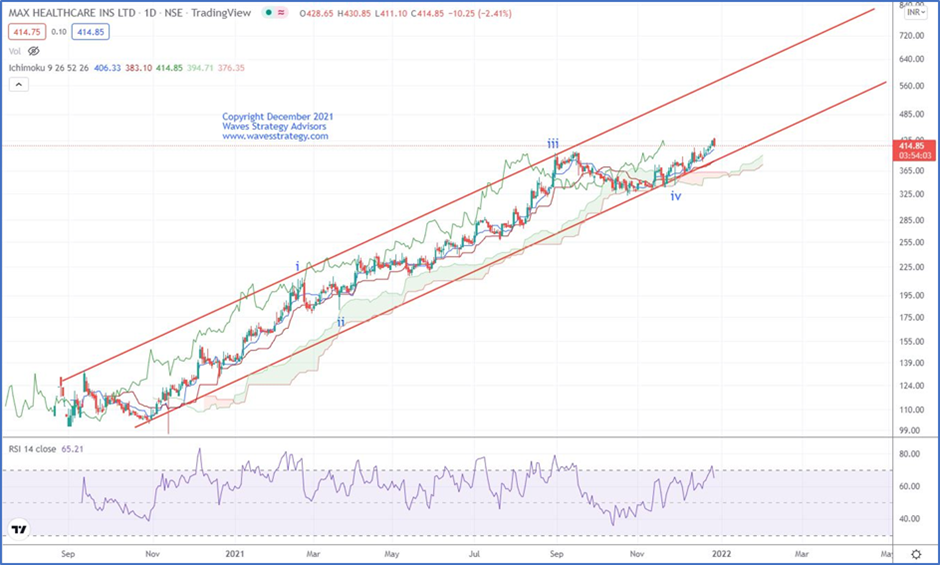
Advanced Elliott wave is the GPS of the market that helps to understand the overall maturity of the trend. We can see how M&M has been moving in sync with our counts. Post completion of Primary wave (4) which was near the Covid low, the entire rise has been in impulse in nature. Wherein, recently wave iv got completed on the downside in the form of an irregular flat pattern (3-3-5). As of now, the current rise has retraced its prior leg in faster time it suggests that internal wave v of wave (iii) has started to unfold on the upside. 

In nutshell, we can conclude by saying that when Price, Time, and Elliott wave all in sync it can lead to interesting results even in stocks

Want to know more about such stocks M&M is on the mark! subscribe to our Vayu Short-Term Update: Get a list of stocks with high growth potential: Check Here

Trishul Membership – Options Trading with Elliott wave, Neo waveIchimoku cloud, and sacred science of trading & forecasting is covered in the Trishul membership program scheduled on 7th - 8th June & 12th - 13th July, Know more here

Monday, May 19, 2025

TANLA Path Predicted with price action and simple indicators.

 When combining basic price patterns with technical indicators like Bollinger Bands, one can effectively capture significant movements in stocks. See how we captured a significant move of more than 9% in Tanla Platform Ltd stock.

We published the following research on Tanla Platforms Ltd on 14th May 2025 in the “Vayu Momentum Report” which our subscribers receive pre-market every day.

TANLA Daily chart Anticipated as on 14th May 2025

Wave Analysis as on 14th May 2025:

In the previous session, Tanla Platforms Ltd gained more than 12%. On the daily chart, the stock had been trading into well-defined consolidated zone of 409-529 levels since early March 2025 but in previous session stock finally managed to give a breakout of the said range and closed at 557 levels backed by a sharp rise in volumes confirming the strength of the breakout. Along with this, Bollinger bands® have just started to expand which is also a positive sign. However, post sharp rise, buying on dips appears to be a smart approach to ride the trend for the better risk management.

In a nutshell, trend for TANLA has shifted to the positive side. Use dips as a buying opportunity for a move towards 600 levels as long as 530 holds on the downside.

Key Resistance: 600

Key Support: 530

Trading Strategy: Use dips towards 540-545 as a buying opportunity with the targets of 570 followed by 600 with the stoploss of 530 levels.

Tanla Daily chart Happened as on 19th May 2025

Happened: After we published the report, the stock moved in sync with our expectations. Tanla Platforms ltd showed a rise of more than 9% and BANG ON!! Prices managed to achieve our target 1 and made a high of 589 levels which is near our target 2. We successfully captured this entire rise by price action and simple indicators.

It is fascinating to see how accurately combining basic indicators like Bollinger bands along with price action can help to predict price targets with accuracy.

Trishul Membership – Options Trading with Elliott wave, Neo waveIchimoku cloudand sacred science of trading & forecasting is covered in the Trishul membership program scheduled on 7th - 8th June & 12th - 13th JulyKnow more here

Apollo Micro Systems Ltd BANG ON!! Rallied by 11%

 When we combine basic price action with technical indicators like Parabolic SAR and Volume, it can lead to remarkable results in trading. Check out how Apollo Micro Systems Ltd. rallied by more than 11% in just 5 trading session after our report was published.

We published the following research on Apollo Micro Systems Ltd on 12th May 2025 in the “Vayu Momentum Report” which our subscribers receive pre-market every day.

APOLLO Daily Chart Anticipated as on 12th May 2025Wave Analysis:

In the previous session, Apollo Micro Systems Ltd surged by more than 11% supported by high volume. The stock had been trading in the broader range of 103-130 levels since past 12 weeks and in the previous session, prices finally gave a breakout of the said range and closed above 130 levels.

On the daily chart, we have applied parabolic SAR which used to determine the price direction as well as draw attention to when the price direction is changing. A series of dots placed below the price which is deemed to be a bullish signal. Post sharp surge, buying on dips appears to be a smart approach to ride the trend with better risk management.

 In a nutshell, trend for APOLLO is bullish. Use dips as a buying opportunity for a move towards 143 levels as long as 123 holds on the downside.

Key Resistance: 140

Key Support: 123

Strategy: Use dips towards 127-128 levels as a buying opportunity with the targets of 135 followed by 140 levels with the stoploss of 123 levels.

APOLLO Daily Chart Anticipated as on 16th May 2025Happened: After we published our report, the stock moved in sync with our expectations. APOLLO showed a rise of more than 11% in just five trading session and BANG ON!! The stock managed to achieve our both targets and made a high near of 141 levels. We successfully captured this entire rise by Price action combined with simple indicators.

It is fascinating to see how accurately combining basic indicators combined with price action can help to predict price targets with accuracy.

Brahmastra (Mentorship) on Timing the market – Equip yourself with tools of Elliott wave, Neo wave, Time cycle, stock selection algo creation, Multibagger and momentum stocks identification along with exact trade setup that actually works. Only a few seats left!  Know more here

MAX HEALTHCARE INDUSTRIES, Multibaggar stock moved by more than 270% in 3 Years!!

 We featured Max Healthcare Industries in our Jal Multibagger Stock Report published on 28th December 2021, highlighting its strong potential to deliver Multibagger returns within 1–2 years.

Since then, the stock has not only sustained its uptrend but has also rewarded investors handsomely by delivering over 270% returns in just 3 years. In the Month of January 2025, it hit a lifetime high of 1227.95 levels, see below how we identified this stock.

MAXHEALTH weekly Chart (Log Scale): Anticipated as on 28th December 2021Wave Analysis as on 22nd February 2024:

Multi-bagger stock recommendation: Max Health

Buy Price – Buy at cmp 413 and add more in staggered fashion on dips towards 350 levels.

Time Horizon –1 to 2 years

Investment – 5% of capital

Target price - 725 levels

Stop loss – 250 levels

Wave Analysis as on 28th December 2021 -

MAXHEALTH is in the hospital chain sector and this stock has been an outperformer since its listing in late 2020. This stock has the potential to be a multi-bagger over the next couple of years.

In the weekly chart of MAXHEALTH is moving in an impulse pattern since November 2020. The stock completed wave iv near the low of 340 levels in November 2021. After the formation of this low, price has shown recovery and has managed to reach new lifetime highs near 430 levels in the form of a primary wave (1).

The overall rise of primary wave (1) has been within the rising channel. The Ichimoku cloud is acting as a good dynamic support level for this rally and one can use dips towards the cloud as buying opportunity. Currently, intermediate degree wave v is unfolding on the upside. As per Elliott wave theory guidelines usually wave i and wave v move in equality. Here we have projected the logarithmic equality of wave i with wave ii represented by the square which gives a target close to the upper end of the channel near 725-750.

In a nutshell, MAXHEALTH seems to have started a long term up move. One can buy at current levels near 413 and add more quantity in case price dips towards 350 levels for a move towards 725 or higher levels. Place the stoploss at 250 levels which is a crucial support level.

MAXHEALTH weekly Chart (Log Scale): Happened as on 14th May 2025

Happened as on 14th May 2025, Max Healthcare has performed exactly in line with our expectations, delivering exceptional returns. The stock has surpassed our projected targets and gave massive gain of over 270% in just three years. Stock showed one side rally and has touched its fresh record high near 1227.95 levels in January 2025. The overall up move has been strong with a higher high and higher low formation which keeps the Primary trend on the side of the bulls.

Want to know more about such stocks like Max Health Industries which is on the mark! subscribe to our Jal Multibagger stock report. Get a list of stocks with high growth potential: Check Here

Brahmastra (Mentorship) on Timing the market – Equip yourself with tools of Elliott wave, Neo wave, Time cycle, stock selection algo creation, Multibagger and momentum stocks identification along with exact trade setup that actually works. Only a few seats left! Know more here

Elecon Engineering on Point with Price action and simple Price Indicators!

 It is possible to capture big moves in stock using price action along with simple indicators like the ADX (Average Directional Index)

We combined simple indicators like Bollinger bands with price action which helped us capture a move of more than 9% in Elecon Engineering Ltd. It's impressive how combining these simple indicators with price action can pinpoint momentum stocks for short-term trades, leading to substantial returns.

We published the following research on Elecon Engineering on 7th May 2025 in the “Vayu Momentum Report” which our subscribers receive pre-market every day.

Elecon Engineering Daily Chart Anticipated as on 7th May 2025Wave analysis as on 7th May 2025-

On the daily chart, Elecon Engineering Ltd post reversing from the lower Bollinger bands® saw a sharp rally towards the upper Bollinger with a gain of more than 56% in span of 1 month. Also, since 28th April not a single candle has closed below prior candle’s low which is a positive sign. ADX is showing reading of 34 i.e. above 25 levels which validates the increasing positive momentum in the stock.

Along with this, prices have retraced 62.8% of its entire prior fall which started from October 2024 and for now we expect prices to retrace up to 78.6% i.e. near 660 levels.

In a nutshell, the current trend for Elecon is on the side of the bulls. A break above 605 levels can further lift prices towards 650-660 levels. On the downside, 585 is the nearest support to watch out for!

Key Resistance: 660

Key Support: 585

Strategy: Long positions can be created above 605 with the stoploss of 585 and target of 623 followed by 650 levels

Elecon Engineering Daily Chart Happened as on 13th May 2025

Happened as on 13th May 2025:

Elecon Engineering has been in sync with our expectation as after we published the reportthe stock has been inching higher day by day and BANG ON!! The stock managed to achieve both our given targets in just a matter of 3 trading sessions which is a strong bullish sign. Also, prices surged by more than 9% since then and made a high of 666.50 levels.

We successfully captured this entire up move with the help of simple indicators like Bollinger bands and ADX (Average Directional Index). One needs to combine it with price action for more accurate setups. 

It is fascinating to see how accurately combining basic indicators along with price action can help to predict price targets with higher accuracy.

Brahmastra (Mentorship) on Timing the market – Equip yourself with tools of Elliott wave, Neo wave, Time cycle, stock selection algo creation, multibagger and momentum stocks identification along with exact trade setup that actually works. Only a few seats left! Know more here

PAYTM 57 Days’ Time Cycle – Buy or Sell?

 Is it possible to Time the market? Can we use methods that can predict when will prices reverse with exact date and time even on stocks?

Time Cycle is an advanced Technical Analysis study and it is surprising that such concepts can help to time the market and catch early reversals which improves decision making of the traders.

PAYTM Daily chart with 57 Days’ Time Cycle.J.M. Hurst is known as the father of Time Cycles. He identified that there are a set of standard cycles that work across markets. We need to identify the time cycle working on particular stock or index.

We can see how 57-Days’ Time cycle has worked wonderfully on the stock. Every time near the cycle zone we have seen a bounce on the upside. Currently, prices have already entered into its cycle zone which was due on 5th May and formed a short-term low of 808 levels.  Since then, prices have shown a rise of nearly 10% already which is a strong bullish sign. For now, the stock needs to give a decisive break above 890 followed by 913 levels for cycle to turn on buy side.  

In a nutshell, above research shows power of Time trading and one need to not worry about not missing out the trend as when time is in favour, then we can catch moves well in advance if price action confirms.

Stock is at important juncture. A break above 890 followed by 913 levels is must for the Time cycle to turn on the buy side. On the downside, 808 should remain protected.

Brahmastra (Mentorship) on Timing the market - Equip yourself with tools of Elliott wave, Neo wave, Time cycle, stock selection algo creation, multibagger and momentum stocks identification along with exact trade setup that actually works. Only a few seats left! Know more here

How to Catch Momentum Using Rounding Bottom combined with Bollinger bands?

 When combining basic price patterns with technical indicators like Bolling Bands and Volume, it can lead to remarkable results in trading. Check out how KPRMILL LTD rallied by more than 9% in a single trading session after our report was published.

It's impressive how combining these simple indicators with price patterns can pinpoint momentum stocks for short-term trades, leading to substantial returns

We published the following research on KPR MILL Ltd on 09th May 2025 in the “Vayu Momentum Report” which our subscribers receive pre-market every day.

KPRMILL Daily chart Anticipated on 09th May 2025 
Wave Analysis on 09th May 2025:

In the previous session, KPRMILL jumped by nearly 8% with significant rise in the volume which is the highest volume post August 2024 and made a life time high of 1217 levels. The stock is under the formation of rounding bottom pattern and trading near its neckline of 1194 levels. A breach of it can result into breakout of the pattern. 

Prices have given a breakout of the upper Bands with bands expanding suggesting that positive momentum can continue to be seen. Stock is following 3 candlesticks rules which gives more conviction to our overall view which is on bullish side. However, RSI is trading at the overbought zone so buy on dips looks to be a wise strategy to ride the trend better.

In a nutshell, trend for KPRMILL is bullish. Use dips as a buying opportunity for a move towards 1300 levels as long as 1136 holds on the downside.

Key Resistance: 1300

Key Support: 1136

Strategy: Use dips towards 1155-1160 as a buying opportunity with the targets of 1230 followed by 1270 with the stoploss of 1136 levels.

KPRMILL Daily chart Happened on 09th May 2025:

Happened: After we published our report, the stock moved in sync with our expectations. KPRMILL showed a rise of more than 9% in just a single trading session and BANG ON!! The stock managed to achieve our target 1 and made a fresh high near of 1265 levels which was near our target 2 levels. We successfully captured this entire rise by price pattern combined with simple indicator.

It is fascinating to see how accurately combining basic indicators like BollingerBands along with Rounding Bottom can help to predict price targets with accuracy.

Want to know more about such stocks KPRMILL LTD is on the mark! subscribe to our Vayu Short-Term Update: Get a list of stocks with high growth potentialCheck Here

Brahmastra (Mentorship) on Timing the market – Equip yourself with tools of Elliott wave, Neo waveTime cyclestock selection algo creation, multibagger and momentum stocks identification along with exact trade setup that actually works. Only a few seats left! Know more here

NIFTY Bang On: Power of Neo wave and Time cycle

 Nifty had been moving precisely as we have been forecasting to the very hour. We have been tweeting about Nifty movement with time on the twitter (X) handle @kyalashish and the move has been just precise.

We derived path for Nifty and posted it on our tweeter handle yesterday i.e. on 07th May 2025. See details about it below.

Following was tweeted across on 07th May morning –

Nifty Happened on 7th May 2025

In the yesterday’s morning tweet, we mentioned -buy on dips to 24280 on a positive reversal candle for move back to 24450 levels, BANG ON! Nifty made high of 24449.60 by 9.30, reversed to 24285 & again moved to 24430, despite of event levels are working like magic.

Neo wave can give exact direction and target for stocks and even on Indices. Neo wave works like wonder even on the smaller time frame like 1 hour and 15 mins. Strategies can be built keeping by combining it with Time cycle & price action for precise entry points.

 AGNI (index) Research - Get access to daily research reports on Nifty along with charts, and options strategy. Know more.

Brahmastra (Mentorship) on Timing the market – Learn the complete science of Trading using technical analysis, risk money management, time trading techniques, complete handholding, and lifelong association in an upcoming mentorship program with the live trading session, Know more here

ETERNAL Path Ahead with Time Cycle and Elliott wave combined!

 Elliott wave is the GPS of the market that helps to understand the overall maturity of the trend. Eternal Ltd is at an important juncture along with Time cycle ongoing. By combining the advanced Elliott wave with Time cycle, one can forecast further path for the stock.

New traders want to trade and capture every moves & on other hand seasoned ones know the real money lies in sitting tight and try to capture the best of the 3rd wave.

ETERNAL weekly chart
On the above chart, we can see how our selected time cycle 144 weeks had played out so perfectly. Time cycle has consistently captured all the recent lows before prices saw a sharp rise on the upside which can be seen clearly on the above chart. Recent low was also captured by this cycle which was made in the month of April 2025 near 195 levels and from it prices saw sharp reversal on the upside of nearly 24% already. A break above 245 can turn cycle on the buy side.

As we can observe, ETERNAL have been moving in sync with our wave counts. Primary wave (1) recently got completed on the upside in September 2024 and since the entire fall has been unfolding in the form of wave (2) which is further subdividing in nature. Wherein, it looks to be unfolding in the form of an irregular flat pattern (3-3-5) as wave b has retraced more than 100% of wave a. For now, a decisive break above 245 levels can confirm completion of wave (2) on the downside. Then the rise would be in the form of primary wave (3).

On the above chart, prices have retraced more than 38.2% of the prior fall and now with follow up buying we can expect prices to retrace minimum to 61.8% i.e. 259 levels.

 In a nutshellEternal looks to be at the important juncture. A break above 245 levels can turn cycle on the buy side and can also confirm completion of wave (2) on the downside. Once this happens, fresh rise can be seen in the form of wave (3).  On the downside, 210 is the nearest support to watch out for!

We can conclude by saying that when Price, Time, and advanced Elliott wave when all in sync it can lead to interesting results even in stocks.

For such more powerful and strategic insides about stocks and indices, subscribe to our Monthly report

Brahmastra (Mentorship) on Timing the market – Learn the complete science of Trading using technical analysis, risk money management, time trading techniques, complete handholding, and lifelong association in an upcoming mentorship program with the live trading session, Know more here

Tuesday, May 6, 2025

ITC - Identifying bottoms Using Time Cycle

 Time Cycle is a Technical Analysis study and it is surprising that such concepts can help to time the market and catch early reversals which improves decision making of the traders.

J.M. Hurst defined that there are standard cycles that exists and it is possible to identify the actual cycles on the stock market.

ITC Daily chart with 55 Days’ Time Cycle.
We have applied 55-period cycle on the daily chart and we can observe how prices have been following our plotted cycle. Currently, we have entered into the cycle zone for ITC. For now, the cycle can turn on the buy side once prices break above its previous swing high level which is near 417 levels.

In a nutshell, ITC is at an important juncture. As the stock has entered into its cycle zone. Next few days price action is important, a breach above 417 levels is needed for cycle to turn on the buy side. On the other hand, on the downside 390 is the nearest support to watch out for! 

Above research shows power of Time trading and one need to not worry about not missing out the trend as when time is in favour, then we can catch moves well in advance if price action confirms.

Brahmastra (Mentorship) on Timing the market – Learn the complete science of Trading using technical analysis, risk money management, time trading techniques, complete handholding, and lifelong association in an upcoming mentorship program with the live trading session, Know more here

Monday, May 5, 2025

Nifty Elliott wave path cannot be more accurate!

 It is possible to forecast the market using the simple scientific method of Elliott wave.

Below chart was discussed during the weekly webinar with 1000’s of participants. Wherein, we anticipated a possible continuation of a fall in Nifty and then resumption of uptrend in form of wave (5).

Nifty Daily chart with Elliott wave Anticipated in December 2024 in Weekly webinar
Nifty Daily chart happened as on 05th May 2025
Nifty has been moving precisely the way we have been forecasting as per Elliott wave, and continued to work extremely well as expected. In the month of December 2024, we anticipated continuation of fall in form of wave (4) and expected it to get completed near 21800-22000 mark, and post which uptrend can resume in form of wave (5) and Bang on!

On the above chart, we can see that Nifty made a low of 21743 levels where wave (4) looks to have completed on the downside and Nifty has started wave (5) of [3] on the upside. As per guidelines, wave (5) usually retraces 1 time of wave (1). As per this, wave (5) might reach towards 27000 or to higher levels.

One needs to ensure to follow the rules of Elliott wave and Neo wave to trade with high conviction!

So, for now one should keep accumulating on dips as long as 23200 levels which is an important Gapp support area remains intact on the downside for medium to long term.

In a nutshell, by knowing the science of Elliott wave along with price action it is possible to form strong trading strategy right from short term intraday to positional investments.

Brahmastra (Mentorship) on Timing the market – Equip yourself with tools of Elliott wave, Neo waveTime cycle, stock selection algo creation, multibagger and momentum stocks identification along with exact trade setup that actually works. Only a few seats left! Know more here

Is Bank Nifty in Sync with the Advanced Tools?

 Time Cycle is a Technical Analysis study and it is surprising that such concepts can help to time the market and catch early reversals which improves decision making of the traders.

Neo wave along with a Time cycle helps to form powerful setups with a good accuracy. See detail below article on Bank Nifty.

Using the power of Time cycle and Neo wave, we anticipated Bank Nifty's next move in our previous monthly report that was published on 24th March, 2025 — Check it out!

Bank Nifty Daily Chart: Anticipated as on 24th March 2025.

Wave Analysis as on 24th March 2025.

Bank Nifty path ahead - The monthly low in March 2025 was on the lower trendline support from where we have witnessed sharp move in just a weeks’ time. This further adds to the possibility that the major low is formed and Bank Nifty is headed to lifetime high levels. Many will miss out this trend and keep questioning the rise but over wave pattern and time cycles are in sync for the up move after six months of downside correction.

Neo wave pattern- The entire rise from the lows of Covid 2020 was in form of Diametric pattern. Prices complete this pattern at the top near 54467 made in month of September 2024. Post that the fall looks to be in contracting wedge-shaped pattern. This fall can be wave X and now another set of up move is resuming. Bank Nifty can touch 54500 lifetime high levels very quickly as the fall can be retraced in just 1/4th or ½ of the time. So, we can expect move to 54500 in 1-2 months.

Bank Nifty with 54 Days’ Time cycle -Every Index has its own Time cycle and here on the daily time frame we are showing 54 days’ time cycle which works extremely well on the Bank Nifty chart. Every time near the cycle zone we have seen a bounce on the upside. Currently, as we have entered into cycle zone, prices have already shown a sharp positive move.

Bank Nifty Daily Chart: Happened as on 30th April 2025.

Happened – After we published our monthly report, Bank Nifty has been in sync with our expectations! The Index as mentioned achieved its lifetime high of 56098 levels in the month of April which was anticipated way before it actually happened.

Along with this Bank Nifty has followed the advanced tools perfectly. The target of 54500 levels were derived as per the Neo wave perspective and BANG ON!! Prices moved precisely as expected and made a fresh high of 56098 levels. When we published our report, prices had already entered into its cycle zone which was due on 25th March. Thereafter, prices formed a low of 49156 levels in the month of April where internal wave b got completed on the downside. Despite concerns over growing global tensions, the Index sky rocked and showed a move of nearly 7000 points on the upside in just 15 trading sessions

For such Bank Nifty levels and strategic insights, join our Prithvi Membership where you get expert analysis and actionable levels. Click here.

Brahmastra (Mentorship) on Timing the market – Equip yourself with tools of Elliott wave, Neo waveTime cycle, stock selection algo creation, multibagger and momentum stocks identification along with exact trade setup that actually works. Only a few seats left! Know more here