Monday, April 28, 2025

Is Nifty Resuming the BULL RUN?

 Nifty has been climbing the wall of worry. Despite of all the events and negative news Indian equity markets have continued to stay buoyant.

Advanced Elliott Wave along with Time cycle provides good trading opportunity and possible reversal areas

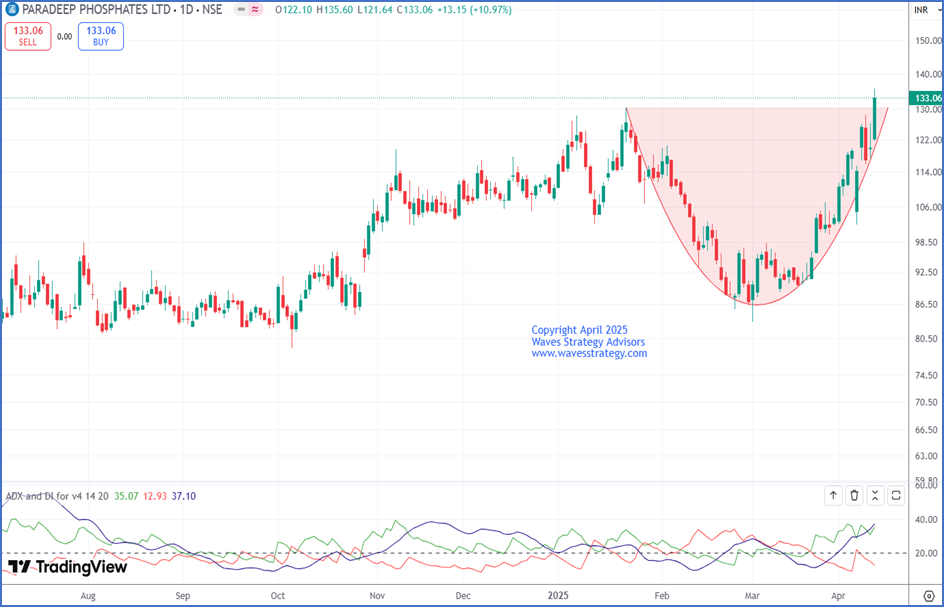
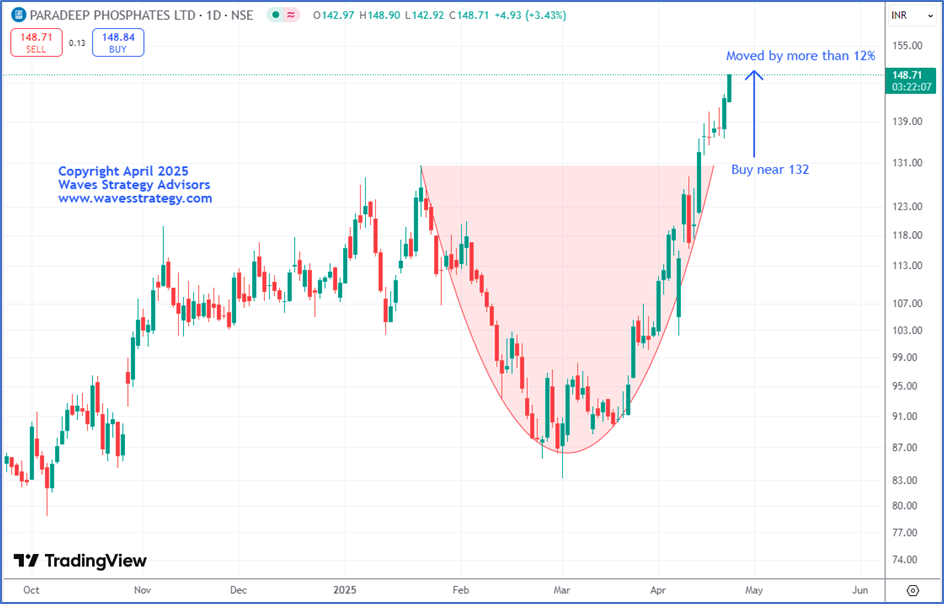
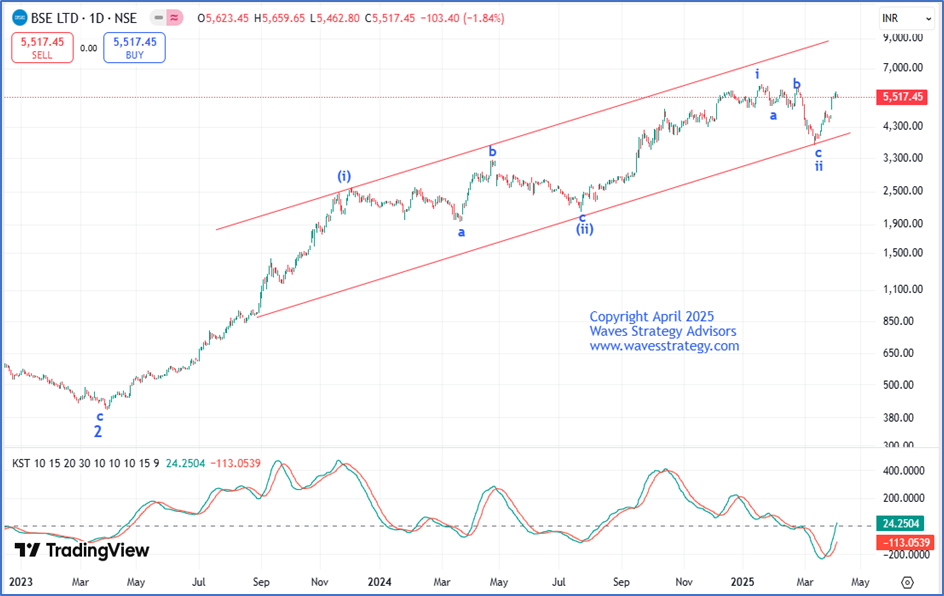
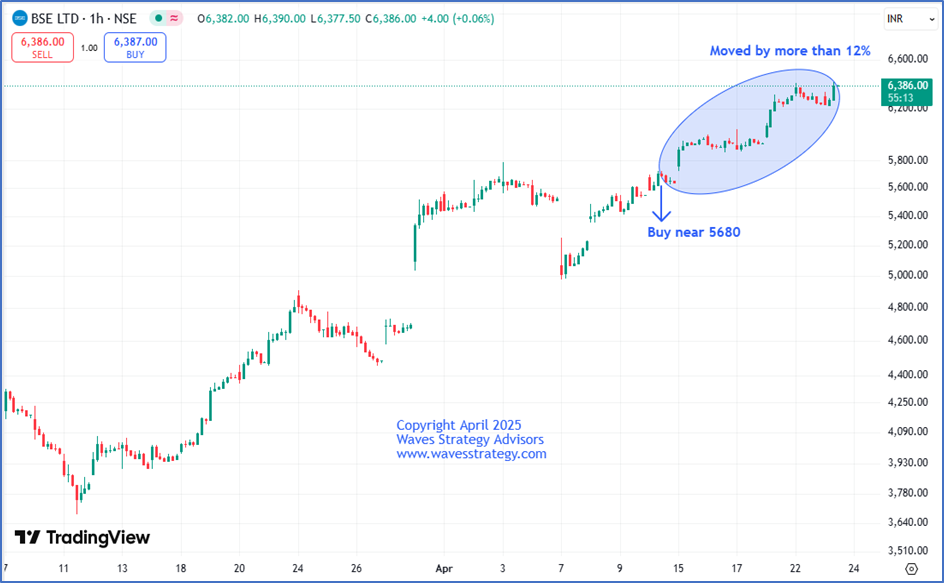
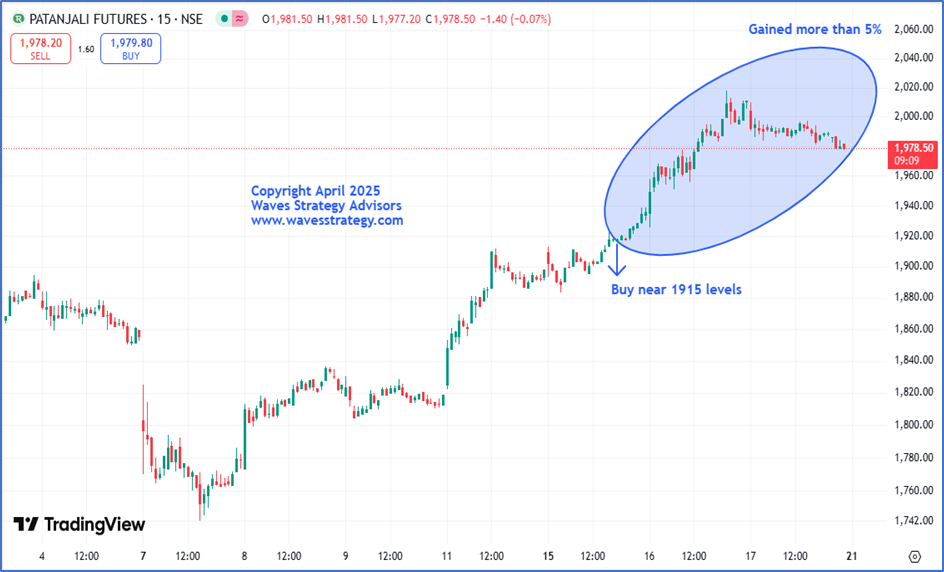
Below chart is published in our daily research report (AGNI) and also in monthly research – can be referred over here

Nifty Daily Chart
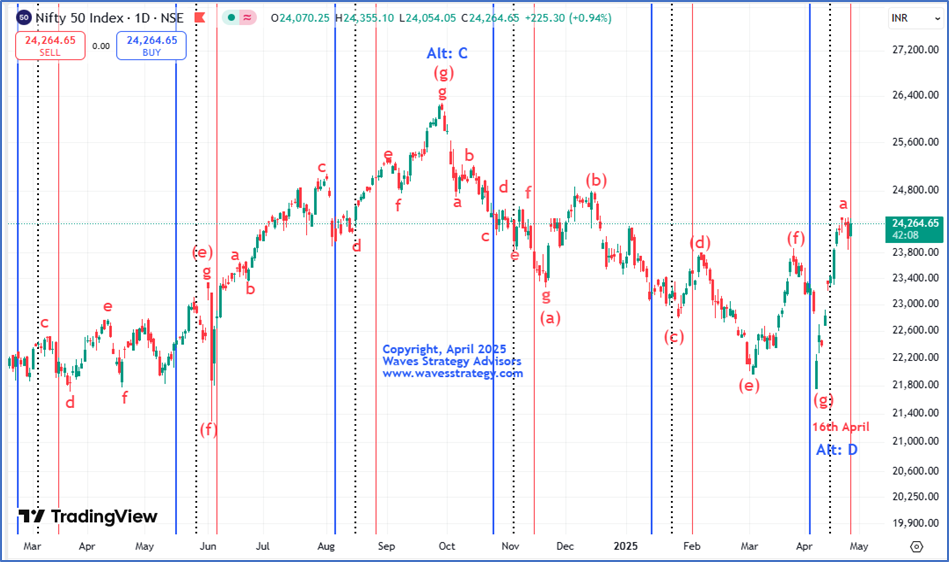
Following excerpt is picked up from our monthly research report - Nifty is on verge of a major breakout. A higher low from here on weekly time frame followed by higher high will further confirm upside reversal as per Dow Theory. Time cycle of 85 weeks along with Neo wave is hinting towards resumption of the BULL Market which many might miss out again.! Do note as short term indicators are over bought, we do not rule out possibility of sudden downside reversal on account of profit booking but that will only be temporary. A higher high higher low formation on weekly charts will be the major confirmation for resumption of the “MOTHER OF ALL BULL MARKET

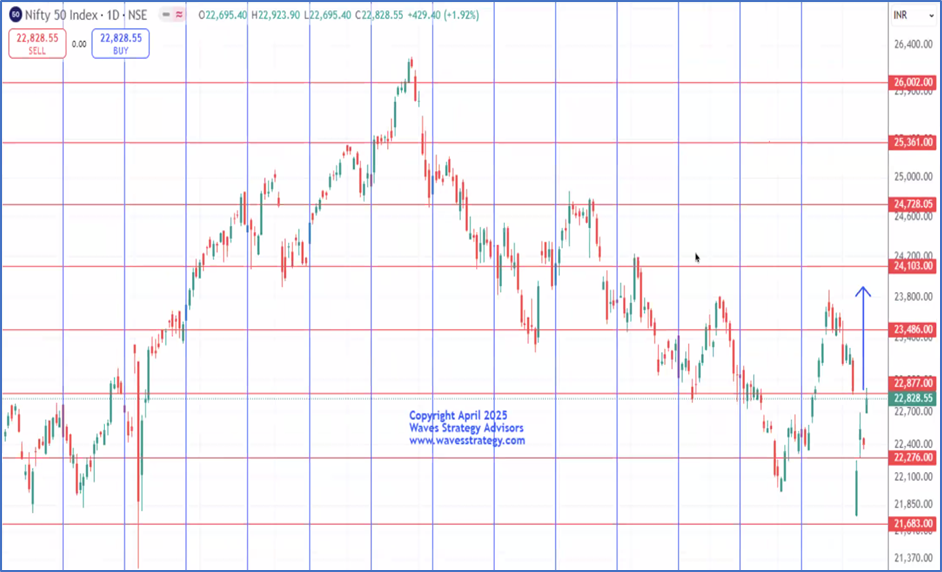
Trump Tariff impact – As we mentioned that 21900 levels should hold on the downside much earlier than the tariff announcements. Post the 26% tariff announcement imposed by Trump on 4th April and reciprocal step taken by china, India markets on 7th April collapsed by more than 1000 points but still managed to protect 21900 levels on closing basis.

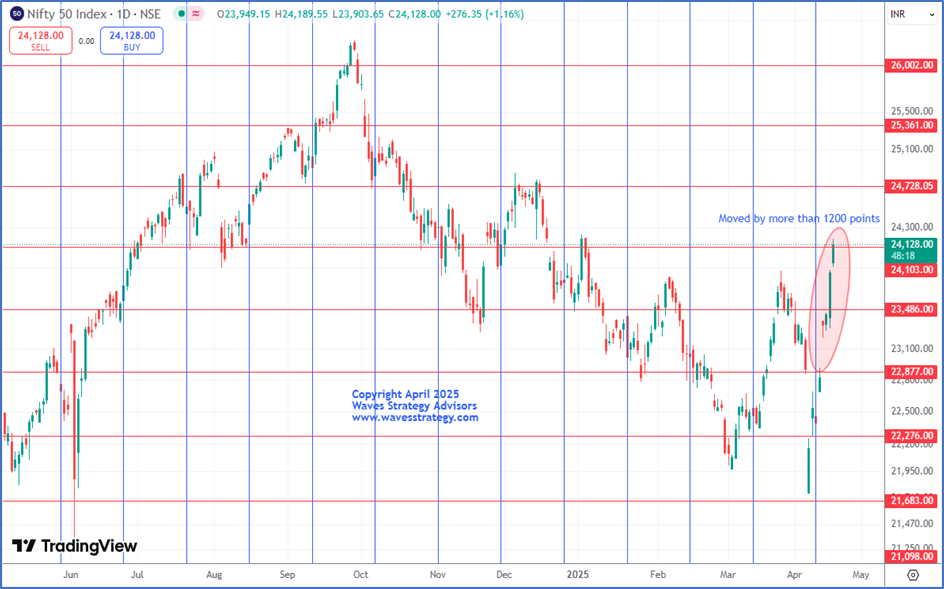
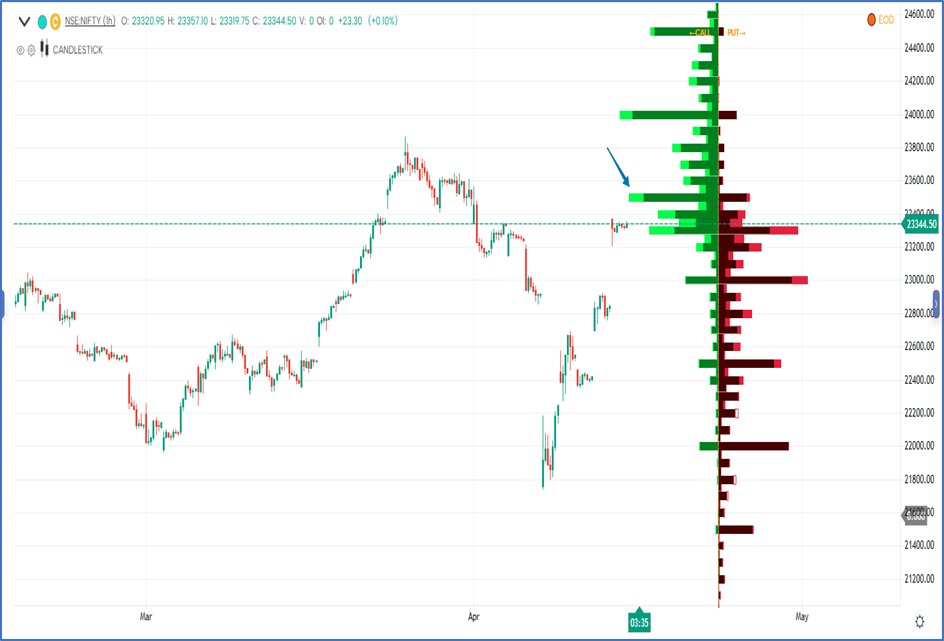
We have turned bullish when Nifty was near 22500 levels and have been maintaining the same stand since then. Nifty already touched the high near 24360 levels – a move of more than 1800 points.

We believe that, “Events do not drive the freely traded markets but only results into short term volatility and eventually the original trend resumes!”

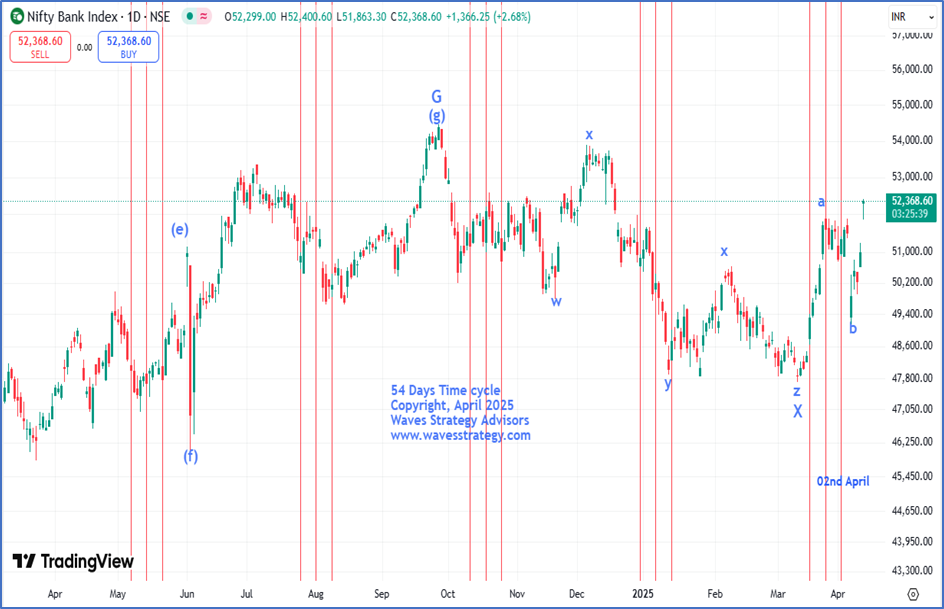
As we can see Nifty saw a sharp recovery of more than 2600 points from the low of 21743 levels which was in sync with our 55-days’ time cycle. This showcases that despite of the event there was a short-term knee jerk reaction but prices immediately resumed on the upside.

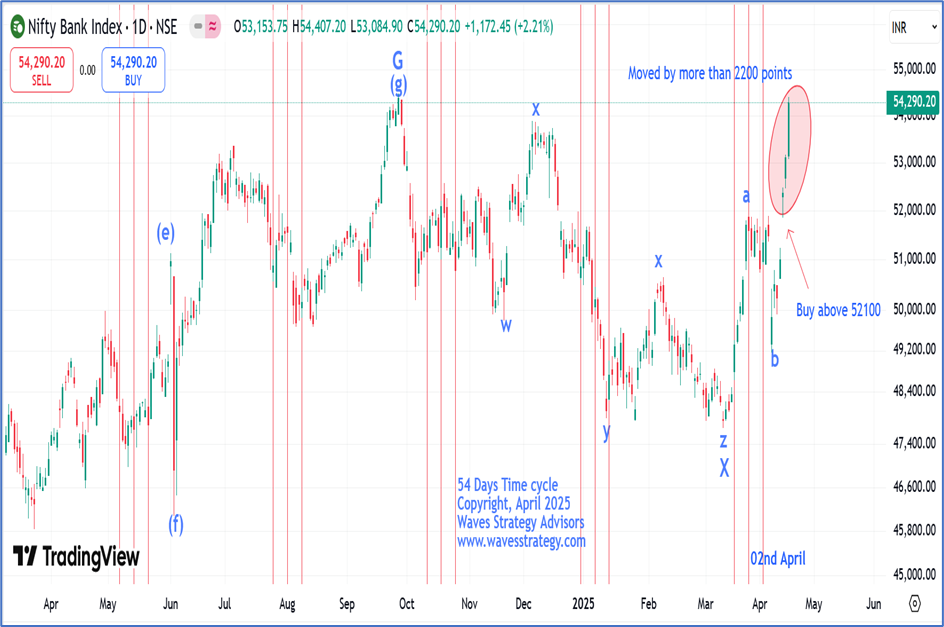
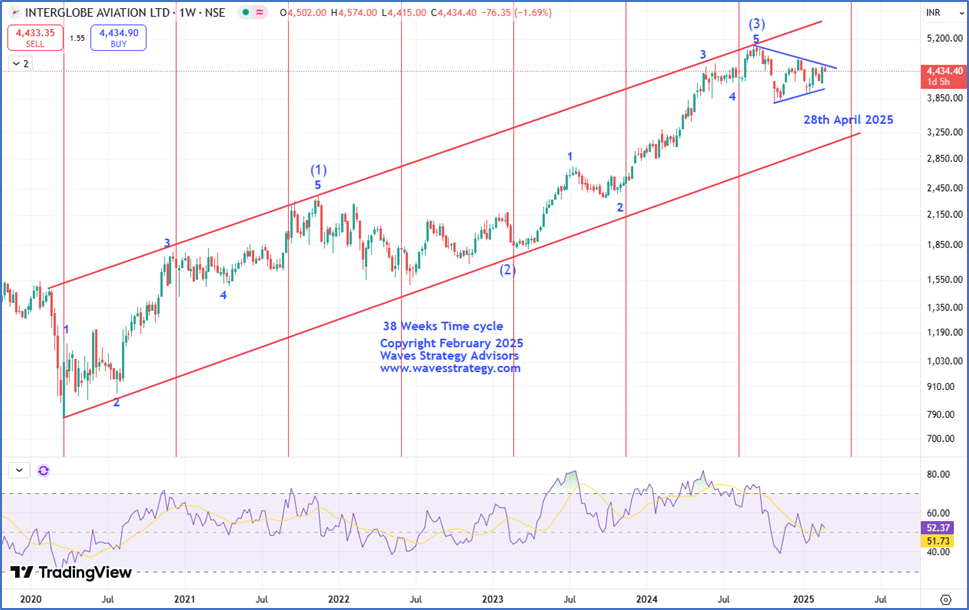
According to the wave perspective, as the recent rise retraced the prior fall in less time so it looks that the entire rise is impulse in nature and we are only in wave a or 1 and we are yet to see wave 2 or b which might be of 10-12 days of consolidation. Post completion of wave 2 or b we can expect a strong rise in the form of wave 3 or c towards lifetime highs in coming months.

By combining this science of Time tradingNeo Wave and Price action it is possible to forecast the market and enter early on when majority have been focusing on the events.  

Brahmastra (Mentorship) on Timing the market – Equip yourself with tools of Elliott wave, Neo wave, Time cycle, stock selection algo creation, multibagger and momentum stocks identification along with exact trade setup that actually works. Only a few seats left!, Know more here

Thursday, April 24, 2025

How PARADEEP Achieved a 12% Rally - Price Patterns & ADX Insights.

 When combining basic price patterns with technical indicators like ADX, it can lead to remarkable results in trading. See how we captured a significant move in Paradeep Phosphates Ltd stock by applying the ADX momentum strategy. Check out how the stock rallied by more than 12% after our prediction.

We published the following research on Paradeep Phosphates Ltd on 16th April 2025 in the “Vayu Momentum Report” which our subscribers receive pre-market every day.

Paradeep Daily Chart: Anticipated as on 16th April 2025
Wave Analysis as on 16th April 2025:

In the previous session, PARADEEP finally closed above minor 3 days of consolidation and surged by 10.97%.

The stock was witnessing a rounding bottom formation since January 2025 on the daily timeframe. In the previous session, prices finally gave a breakout of it as it managed to close above neckline of 130.50 levels which confirms the breakout of the pattern. Along with this, ADX helps to understand the overall momentum of the stock and now is showing readings of 37 levels suggesting good momentum is likely to continue. However, currently looking at the sharp rise in the previous session buy on dips looks to be a prudent strategy to ride the trend better.

In nutshell, trend for PARADEEP is bullish. Use dips towards 130-132 as a buying opportunity for a move towards 143 levels as long as 128 holds on the downside.

Key Resistance: 143

Key Support: 128

Strategy: Use dips towards 130-132 as a buying opportunity with the targets of 140 followed by 143 with the stoploss of 128 levels.

Paradeep Daily Chart:  Happened as on 24th April 2025.
Happened- After we published our report, the stock moved in sync with our expectations. Paradeep have rallied more than 12% in a short span of time and BANG ON!! Prices not only managed to achieve both our given targets but also is continuing to make new fresh highs and is currently trading at 149 levels. We successfully captured this entire rise by simple price action and ADX.

It is fascinating to see how accurately combining basic indicators like ADX with price action can help predict targets with accuracy.

Want to know more about such stocks on the mark! subscribe to our Vayu Short-Term Update: Get a list of stocks with high growth potential: Check Here

Brahmastra (Mentorship) on Trading - Learn the science of forecasting using Time and Elliott wave, Neo wave, along with risk money management, stock selection algo, Options trading with a complete plan. Limited seats only, Next batch starts in April 2025. Know more here 

Wednesday, April 23, 2025

BSE PATH PREDICTED USING ADVANCED TOOLS!

 When we combine Neo wave along with technical indicators like KST (Know sure thing) it helps to form powerful setups with accuracy. See how we captured a significant move in BSE stock by applying KST and check how BSE has been moving precisely as per the counts.

We published the following research on BSE on 7th April 2025 in the “Vayu Momentum Report” which our subscribers receive pre-market every day.

BSE Daily Chart Anticipated as on 7th April 2025
Wave analysis as on 7th April 2025-

On the daily chart, post reversing from its channel’s support BSE has gained more than 50% in less than one month of span which is a strong bullish sign. Currently, BSE is digesting its steep rise and is trading in a lackluster manner for the past few sessions. A break above its prior day’s high is must to suggest that buying has resumed in the stock. Also, we have applied KST to gauge overall momentum in the asset. Wherein, it has recently witnessed a crossover and now a breach above the zero line can further boost buying in the stock.

As per the wave perspective, recently wave i of intermediate wave (iii) got completed on the upside. Since then, the entire fall has been unfolding in the form of wave ii which was in the form of a flat pattern (3-3-5). For now, the current rise is in the form of wave iii of intermediate wave (iii). As per the Elliott wave guidelines, it is considered to be the strongest and most trending wave.

In a nutshell, BSE is currently consolidating at higher end. A break above 5680 levels can resume buying towards 5850 followed by 6040 levels. On the downside, 5470 is the nearest support to watch out for!

Trading strategy for Intraday Futures – Long positions can be created above 5660 levels with the stoploss of 5632 and target of 5688 followed by 5716 levels.

Trading strategy for Positional Futures – Long positions can be created above 5660 levels with the stoploss of 5608 and target of 5760 levels. (One can book partial profit near 5700-5710 levels and trail stoploss to cost.)

BSE Hourly Chart Happened as 23rd April 2024
Happened as on 23rd April 2025:

BSE has been in sync with our expectation as after we published the reportthe stock has moved as expected and BANG ON!! BSE managed to surge by more than 12% in a short span of time and made a fresh high of 6455 levels which is a strong bullish signAlso, the stock has managed to achieve our given target not only in cash segment but also in the future segment.

We successfully captured this entire up move with the help of simple indicator like KST (Know sure thing)One needs to combine it with price action for more accurate setups. 

It is fascinating to see how accurately Elliott wave along with simple indicators can help to predict price targets with accuracy.

Brahmastra (Mentorship) on Trading - Learn the science of forecasting using Time and Elliott wave, Neo wave, along with risk money management, stock selection algo, Options trading with a complete plan. Limited seats only, Next batch starts in April 2025, Know more here 

Tuesday, April 22, 2025

Nifty Bang on: Power of Neo wave and Time cycles.

 We derived a path for Nifty and posted it on our Twitter handle since two few weeks. Below is the chart which shows a detailed analysis of Nifty which we posted earlier.

Neo wave acts like the GPS of the market and helps to derive possible paths ahead. When combined with Time cycles it helps to form powerful trade setups with accuracy.

Nifty Daily Chart: Anticipated on Twitter as on 10th April 2025
Anticipated as on Twitter on 10th April 2025

We anticipated that post Trump pause in tariff war that was also near our time cycle zone, we expected that this might be a #blackswan event on the upside if the risk is not hedged. We saw a breach above 23800 levels which was our previous time cycle top but failed to close above it.

Happened as on 22nd April 2025

Nifty moved in sync with our expectations and BANG ON!! Prices on 11th April the day after the tweet was published, opened with gap of nearly 300 points. Since then, Nifty has been moving in gaps. Also, prices managed to form the low near our cycle zone which was due on 16th April and reversed on the upside and managed to gain more than 950 points since.  We were able to anticipate this move before it had happened with help of Neo wave and Time cycle concepts.

In a nutshell, the current trend for Nifty is on the positive side. Prices have crossed its Gann levels of 24103 levels and now a move towards the next Gann level of 24728 levels is expected.

By combining this science of Time tradingNeo Wave and Price action one need not worry about missing out as when trend is the favour, one can form powerful trade setups with accuracy.

AGNI (index) Research - Get access to daily research reports and advisory calls on Nifty and Sensex along with charts, and options strategy. Know more.

Brahmastra (Mentorship) on Timing the market – Learn the complete science of Trading using technical analysis, risk money management, time trading techniques, complete handholding, and lifelong association in an upcoming mentorship program with the live trading session, Know more here 

Nifty Path Ahead with Gann square of 9!

 Gann Square of 9 is simplest and powerful way to get key price action support and resistance levels. Gann square of nine gives us crucial levels once prices are in unchartered territory.

It is important to identify the key angle on Gann square of 9 that provides pivot levels that can provide support or resistance to prices.

Nifty Gann square of Nine: Anticipated as on 11th April 2025
Nifty Gann Square of 9: Happened as on 21st April 2025
Nifty has been moving between the Gann levels which is of 180 degrees. These levels have been acting as support or resistance on most of the occasions.

We clearly see from the above chart that prices managed to give a close above 22877 levels and managed to gain more than 1200 points since then which was in sync with our expectations. Currently, Nifty is trading above its Gann level of 24,103 which opens up a possibility for further upside move towards the next Gann level at 24,728.

We expect Index to move towards the next Gann level of 24728. As short-term indicators are overbought it is best to use buy on dips unless we a close below prior day’s low.

In a nutshell, by using this sacred science of Trading – Gann square of 9 and Hurst’s Time cycle it is possible to trade with edge of Time and Price action.

AGNI (index) Research – Get access to daily research reports and advisory calls on Nifty and Sensex along with charts, and options strategy, Know more.

Brahmastra (Mentorship) on Timing the market – Learn the complete science of Trading using technical analysis, risk money management, time trading techniques, complete handholding, and lifelong association in an upcoming mentorship program with the live trading session, Know more here 

Bank Nifty move predicted with the help of Time Cycles and Neo Wave!

 Time Cycle is a Technical Analysis study and it is surprising that such concepts can help to time the market and catch early reversals which improves decision making of the traders.

Neo wave along with a Time cycle helps to form powerful setups with a good accuracy. See detail below article on Bank Nifty.

Using the power of Time cycle and Neo wave, we anticipated Bank Nifty's next move in our previous article that was published on April 15, 2025 — Check it out!

Bank Nifty Daily Chart: Anticipated as on 15th April 2025

Bank Nifty Daily Chart: Happened as on 18th April 2025

Anticipated - The Index has already entered its 54-Days’ Time cycle zone prices and formed a low of 49156 levels near our cycle where internal wave b got completed on the downside. Since then, prices have witnessed a rally of more than 3200 points. Currently, prices are trading above its previous swing high of 52100 levels and now with follow up buying we can conclude that the cycle has turned on the buy side.

Happened – Bank Nifty has been dancing on the tune of time and Bang on!! Bank Nifty moved in sync with our expectations. Bank Nifty finally gave a decisive break above its previous swing high of 52100 levels which turned the 54-days’ time cycle on the buy side. Since then, the Index has moved by more than 2200 points in just 3 trading session!!  We were able to capture this move before it happened with the help of Time cycles and advanced Elliott wave. For now, the recent low of 49156 levels is the crucial support and we expect prices to protect it on the downside.

We can conclude by saying that when PriceTime, and Neo Wave all in sync it can lead to interesting results even in Indices.

For such Bank Nifty levels and strategic insights, join our Prithvi Membership where you get expert analysis and actionable levels. Click here

Brahmastra (Mentorship) on Timing the market – Learn the complete science of Trading using technical analysis, risk money management, time trading techniques, complete handholding, and lifelong association in an upcoming mentorship program with the live trading session, Know more here 

Patanjali Bang on!! Combining Price action and Bollinger bands!

 When combining basic price patterns with technical indicators like Bollinger Bands, one can effectively capture significant movements in stocks. See how we chose Patanjali that achieved our targets in futures and options segment.

Check out how we selected Patanjali which has rallied more than 5% in 2 trading session despite market fluctuations. We published the following research on Patanjali pre-market on 15th April in "Vayu Momentum Report” which our subscribers receive pre-market every day.

Patanjali Daily Chart: Anticipated as on 15th April 2025

Wave Analysis as on 15th April 2025:

PATANJALI closed on a positive note with a massive gain of 4.13%. The stock is moving in a rectangular range over the last few days indicating accumulation in the stock. A daily close above 1915 levels will confirm breakout of the said pattern.

On the daily chart, since 3 trading sessions not a single candle has given a close below prior day's low which is a positive sign. On 7th April, the stock has taken the support of middle Bollinger Bands® and now trading above upper bands®. Also, RSI is trading near 62 levels suggesting that there is enough room left on the upside for the stock to trend further.            

In nutshell, trend for PATANJALI is bullish. A break above 1915 is must for positive momentum to continue with the targets 2040. On the downside nearest support is at 1840.

Trading strategy for intraday futures: Long positions can be created above 1915 with the stoploss of 1903 and target of 1927 followed by 1938 levels.

Trading strategy for positional futures: Long positions can be created above 1915 with the stoploss of 1895 and target of 1955. (One can book part profit near 1930-1935 and trail stoploss to cost).

Trading strategy for options: PATANJALI 1800 CE buy above 123 with stoploss of 110 and target of 148. (One can book part profit near 133-136 and trail stoploss to cost)

Patanjali 15 Min Chart: Happened as on 17th April 2025

Happened as on 17th April 2025

After we published the report, Patanjali moved as expected and Bang On!! Stock moved by more than 5% and achieved our given targets in futures and options in just a matter of 2 trading sessions despite market fluctuation which is a strong bullish sign. Futures in just 2 trading sessions. Also, prices recently managed to break its rectangular range and recently made a fresh high of 2011 levels.

We successfully captured this entire up move with the help of simple price indicators like Bollinger Bands. One needs to combine it with price action for more accurate results!

Brahmastra (Mentorship) on Timing the market – Learn the complete science of Trading using technical analysis, risk money management, time trading techniques, complete handholding, and lifelong association in an upcoming mentorship program with the live trading session, Know more here 

Wednesday, April 16, 2025

Understanding Nifty’s movement with Open Interest.

Options Trading requires an understanding of momentum, trend, time to expiry, and range.

Majority focus only on Open interest but by combining change of Open interest along with Volumes on stocks, indices the overall perception can sharply increase.

Trading conviction increases using this technique of Trading.

Nifty Open Interest chart
Options are amazing instrument to trade but only if one can understand the momentum with price action along with it. For Option buyers, trend and Time are running against them. It is therefore important that Option buyers use OI Profile to create powerful trade setups even for Intraday.

Open Interest – Overall Open interest helps to understand at what level big players are building their positionsOpen interest is always looked from seller’s perspective as they are carrying the risk. As per the above chart, OI profile we can see that 23500 levels is immediate resistance due to high call sellers active there. A break of the above hurdle of 23500 on upside seems to be difficult. On the downside, immediate support is at 23300 levels due to highest build- up on the put side. For now, we expect Nifty to trade between the range of 23300 to 23500 levels and within which wild swings can been seen.

In nutshell, by combining Price action areas using Open Interest a complete trading system can be formed especially for Option buyers.

AGNI (index) Research – Get access to daily research and advisory reports on Nifty, along with charts, and options strategy, Know more

Brahmastra (Mentorship) on Timing the market – Learn the complete science of Trading using technical analysis, risk money management, time trading techniques, complete handholding, and lifelong association in an upcoming mentorship program with the live trading session, Know more here 

Bank Nifty 54 Days’ Time cycle – Buy or Sell?

 Is it possible to Time the market? Can we use methods that can predict when will prices reverse with exact date and time even on index?

Time Cycle is an advanced Technical Analysis study and it is surprising that such concepts can help to time the market and catch early reversals which improves decision making of the traders.

Neo wave along with a Time cycle helps to form powerful setups with a good accuracy. See detail below research on Bank Nifty.

Bank Nifty Daily chart with 54 Days’ Time Cycle.

J.M. Hurst is known as the father of Time Cycles. He identified that there are a set of standard cycles that work across markets. We need to identify the time cycle working on that stock or index.

For Bank Nifty 54 period of Time cycle works extremely well on the Daily time frame. Time trading has to be combined along with price action for precise entry.  Every time near the cycle zone we have seen a bounce on the upside. We can also observe that the Index has also been in sync with its Neo wave counts. When we combine price and time together it helps to create a powerful setup which helps to capture reversals before it has happened.

The Index has already entered its cycle zone prices formed a low of 49156 levels near our cycle where internal wave b got completed on the downside. Since then, prices have witnessed a rally of more than 3200 points which is in the form of wave c which opens up a possibility of a diametric or a triangle pattern as wave b has taken less time to form as compared to wave a. Currently, prices are trading above its previous swing high of 52100 levels and now with follow up buying we can conclude that the cycle has turned on the buy side.

In a nutshell, next few days price action is important. Acceptance above 52416 which is also a Gann level is needed to confirm that the cycle has turned on the buy side. On the downside, 51800 is the crucial support to watch out for!

For such Bank Nifty levels and strategic insights, join our Prithvi Membership where you get expert analysis and actionable levels. Click here

Brahmastra (Mentorship) on Timing the market – Learn the complete science of Trading using technical analysis, risk money management, time trading techniques, complete handholding, and lifelong association in an upcoming mentorship program with the live trading session, Know more here

INDIGO Multibagger stock moved by more than 23% within 2 months!!

 We published about Interglobe Aviation Ltd in our Jal Multibagger stock report and predicted the possibility of multi-bagger returns in the coming 1-2 years. Check out the below research we published on 27th February 2025.   

This stock has managed to hold its gain and gave more than 23% returns in less than 2 months and made a lifetime high of 5265 levels.

 INDIGO Weekly chart Anticipated with Time cycle and Elliott wave as on 27th February 2025
Wave Analysis as on 27th February 2025

Multi-bagger stock recommendation: Interglobe Aviation

Buy Price – Buy at CMP 4430 more on dips

Time Horizon 1-2 years

Investment – 5% of capital

Target price -???

Stop loss –???

Anticipated as on 27th February 2025:

INDIGO is India's largest airline, and one of the world's fastest growing airlines. It is India's largest low-cost passenger airline offering a focus on affordability, punctuality, and passenger satisfaction in the domestic air travel sector with specialization in on-time performance.

As shown in weekly chart of INDIGO, from 2023 to mid-2024 prices moved higher from the levels of 1822 to 5035 levels in the form of primary wave (3) which is more than 170% increase. After the strong bull run this stock was contained within a consolidation and prices drifted lower from the high of 5035 levels

to 3780 levels in the form of wave (4). Post completion of wave (4) the uptrend should resume towards higher levels.

It is now time to look at the bigger cycle in order to understand the probable reversal areas from medium term perspective. Indigo is following 38 Weeks of Time cycle very well and we can observe that exactly at the cycle important bottoms are formed. The next cycle is due by 28th April 2025. One can look for buying opportunity near the same.

So, the stock is in the long-term bull trend and the past few months of correction has provided excellent opportunity to enter now for riding the 5th wave on upside. Also, this is a reversal from major trend and so one should be aware with the risk of investments. On upside we can expect a target of … levels which is conservative level.

Indigo Daily Chart: Happened as on 09th April 2025
Happened

Interglobe Aviation was in sync with our expectations and has delivered exceptional returns. After a dip, stock has witnessed a sharp rise on the upside and moved more than 23% from the lows in less than 2 months after our report was published. Moreover, in today’s session prices managed to make a lifetime high of 5265 levels. Since past 1 month, the stock has managed to sustain at higher levels despite major indices falling and negative global cues which is a sign of strength. The overall up move has been strong and we expect prices to achieve its target of...levels in comings months.

Want to know more about such stocks like Interglobe Aviation Ltd! Subscribe to our Jal Multibagger stock report. Get a list of stocks with high growth potential: Check Her

Brahmastra (Mentorship) on Timing the market – Learn the complete science of Trading using technical analysis, risk money management, time trading techniques, complete handholding, and lifelong association in an upcoming mentorship program with the live trading session, Know more here

Jubliant Foodworks Path Ahead with Time Cycle and Elliott wave combined!

 Elliott wave is the GPS of the market that helps to understand the overall maturity of the trend. Jubilant Foodworks Ltd is at an important juncture along with Time cycle ongoing. By combining the advanced Elliott wave with Time cycle, one can forecast further path for the stock.

Novices think of getting at exact lows and getting out at exact highs but expert traders try to capture the best of the 3rd wave and wait like an eagle for that exact moment to catch the prey most of the time.

JUBLOOD Weekly chart
On the above chart, we can see how our selected Time cycle of 24 Weeks has played out so perfectly. Time cycle has consistently captured all the recent lows before prices saw a sharp rise on the upside which can be seen clearly on the above chart. Recent low was also captured by this cycle which was made in the month of March 2025 near 575 levels and from it prices saw sharp reversal on the upside of nearly 20% was seen. A break above 700 followed by 720 can turn cycle on the buy side.

Advanced Elliott wave helps to understand the overall maturity of the trend and if the rise is sustainable or not.  As we can observe, Jubilant Foodworks have been moving in sync with our wave counts. On the downside, we expect wave 2 of wave (5) to get completed where the recent cycle low of 575 levels was made. For further confirmation, follow up buying is needed

On the downside, we expect wave 2 of wave (5) to get completed in the form of an Irregular Flat pattern (3-3-5) where the recent cycle low which was made near 575 levels.

In a nutshell, Jubilant Foodworks is at a crucial juncture. A break above 720 levels can turn the cycle on the upside and can also confirm completion of wave 2 on the downside. Once this happens, fresh rise can be seen in the form of wave 3.  On the downside, 575 is the nearest support to watch out for!

We can conclude by saying that when Price, Time, and advanced Elliott wave when all in sync it can lead to interesting results even in stocks. 

Want to know more about such stocks on the mark! subscribe to our Vayu Short-Term Update: Get a list of stocks with high growth potential: Check Here

Brahmastra (Mentorship) on Timing the market – Learn the complete science of Trading using technical analysis, risk money management, time trading techniques, complete handholding, and lifelong association in an upcoming mentorship program with the live trading session, Know more here