We featured Mahindra and Mahindra Industries in our Jal Multibagger Stock Report published on 22nd February 2024, highlighting its strong potential to deliver Multibagger returns within 1–2 years.
Since then, the stock has not only sustained its uptrend but has also rewarded investors handsomely by delivering over 91% return within the span of 1.6 years. In today session, Mahindra and Mahindra hit lifetime high of 3432 levels, see below how we identified this stock.
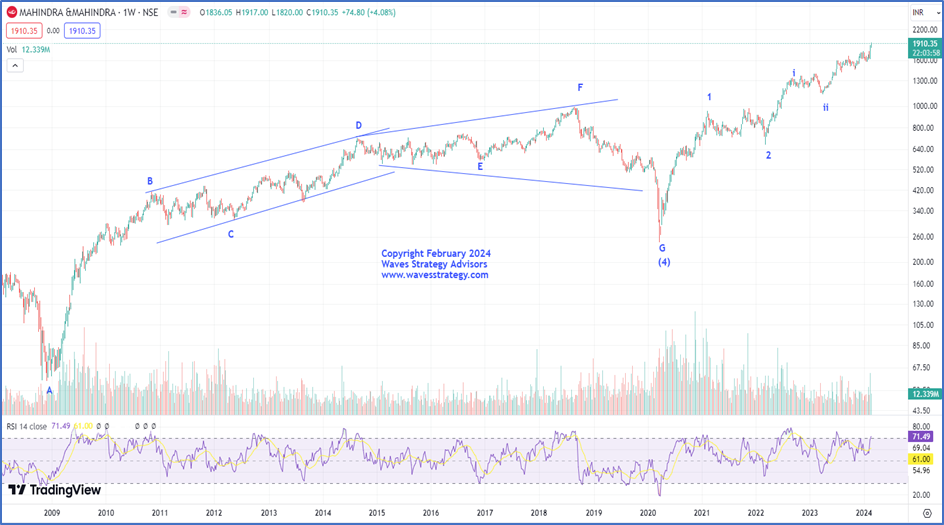
Mahindra and Mahindra Ltd weekly Chart (Log Scale): Anticipated as on 22nd February 2024
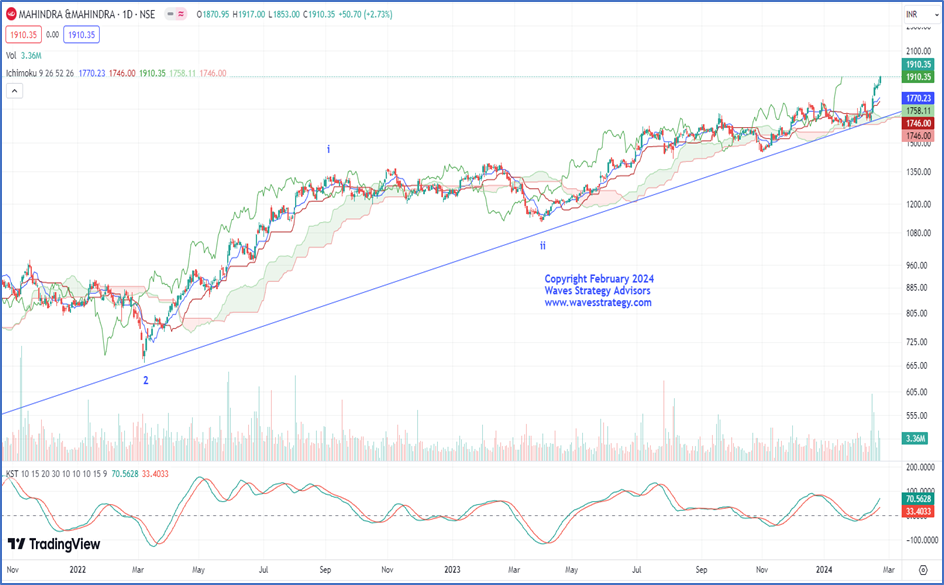
 Mahindra and Mahindra Ltd Daily Chart: Anticipated as on 22nd February 2024
 Wave Analysis as on 22nd February 2024:
Multi-bagger stock recommendation: Mahindra and Mahindra Ltd
Buy Price – Buy at CMP 1910 more on dips towards 1620 level.
Time Horizon –1 to 2 years
Investment – 5% of capital
Target price - 3430 levels
Stop loss – 1140 levels
Mahindra & Mahindra is an Indian multinational automotive manufacturing corporation headquartered in Mumbai. It was established in 1945 as Mahindra & Mohammed and later renamed Mahindra & Mahindra. Part of the Mahindra Group, M&M is one of the largest vehicle manufacturers by production in India. Its unit, Mahindra Tractors, is the largest manufacturer of tractors in the world by volume. The main reason to include this stock in the update is because the stock has given multi fold returns over the years. It has potential to continue to do so in coming years.
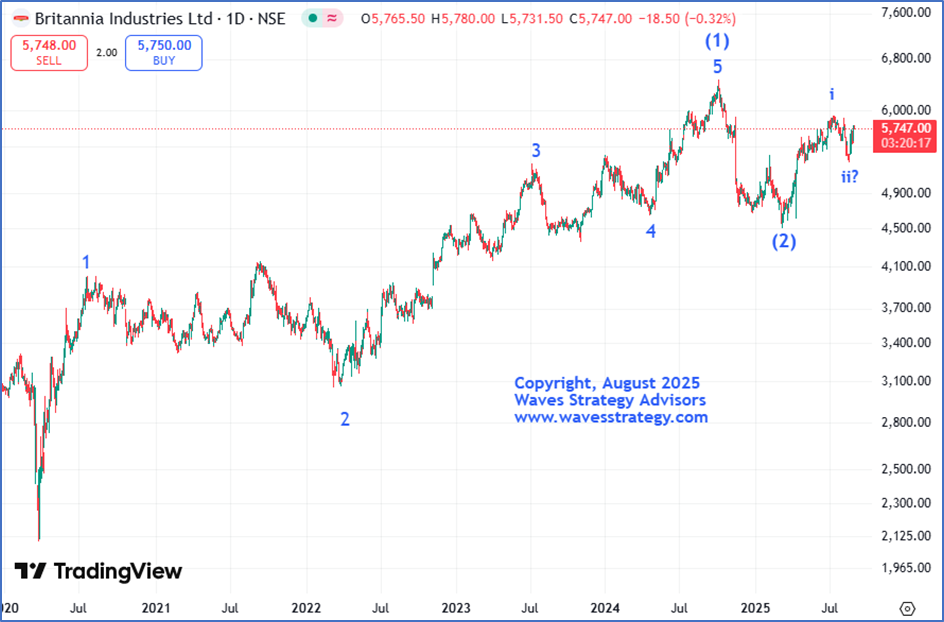
Let’s us understand view for M&M with the help of advance technical tools. As per wave perspective, stock is following classic Elliott wave theory. Wherein, primary wave (4) got completed near 245 levels and currently wave (5) is ongoing. This is one of the reasons why we have seen strong outperformance by this stock in the current rally. Furthermore, this wave (5) has been sub-divided into 5 waves, of which wave 3 of iii is ongoing. Crucial support is at 1140 which is also a low of minor wave ii.
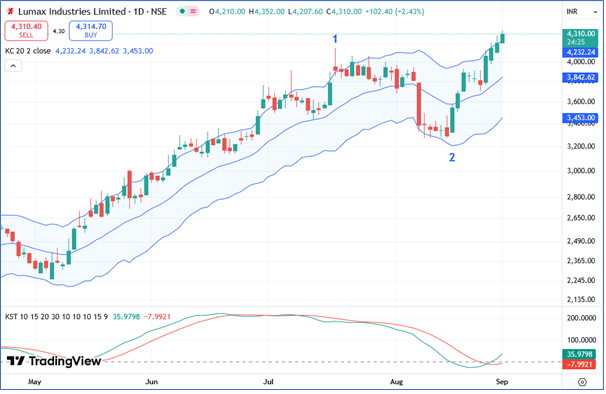
We can observe from the above chart, that the Multimonth trendline has proven to be effective. Since it has consistently offered support. Prices recently found support at that level, and a strong rebound
was observed. Apart from this, KST indicates that strong momentum is likely to continue because it is trading above the zero-line following the crossover.
In short, the trend for Mahindra & Mahindra is positive for the conservative target of 3430 as long as 1140 levels remains intact on downside. Buying can be done in staggered fashion at CMP 1910 and more on dips towards 1620 levels in this stock.
Mahindra and Mahindra Ltd Weekly Chart: Happened as on 18th August 2025:
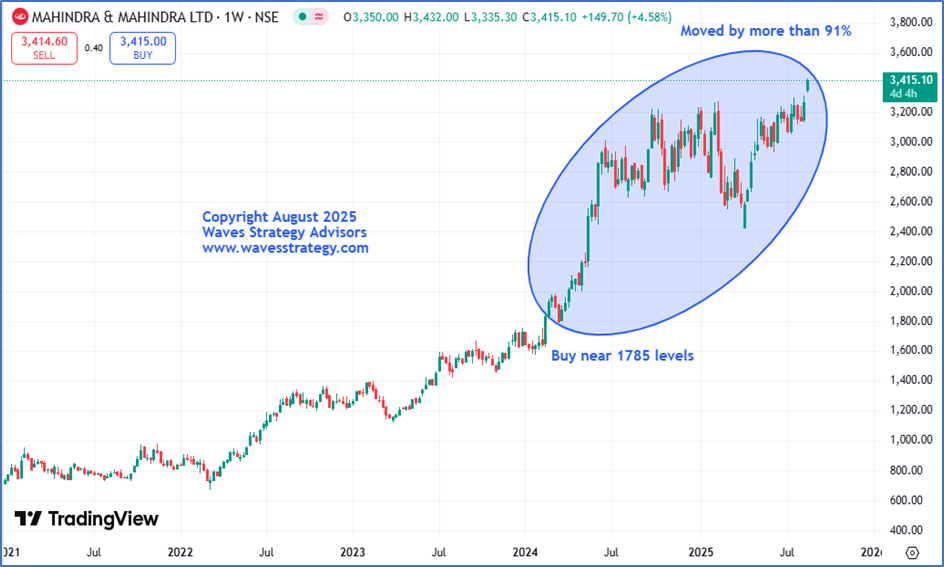
Mahindra and Mahindra Ltd has performed exactly in line with our expectations, delivering exceptional returns of more than 91% in 1.6 years and BANG ON!! The stock showed one side rally and achieved our given target of 3430 levels which was near its fresh record levels. The overall up move has been strong with a higher high and higher low formation which keeps the Primary trend on bullish side as per the Dow Theory.
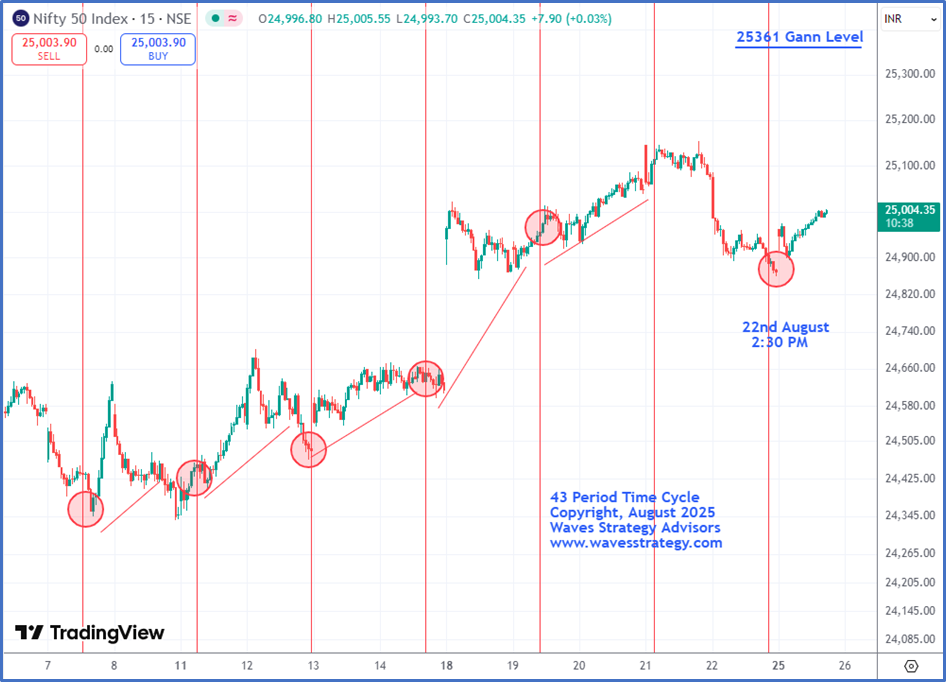
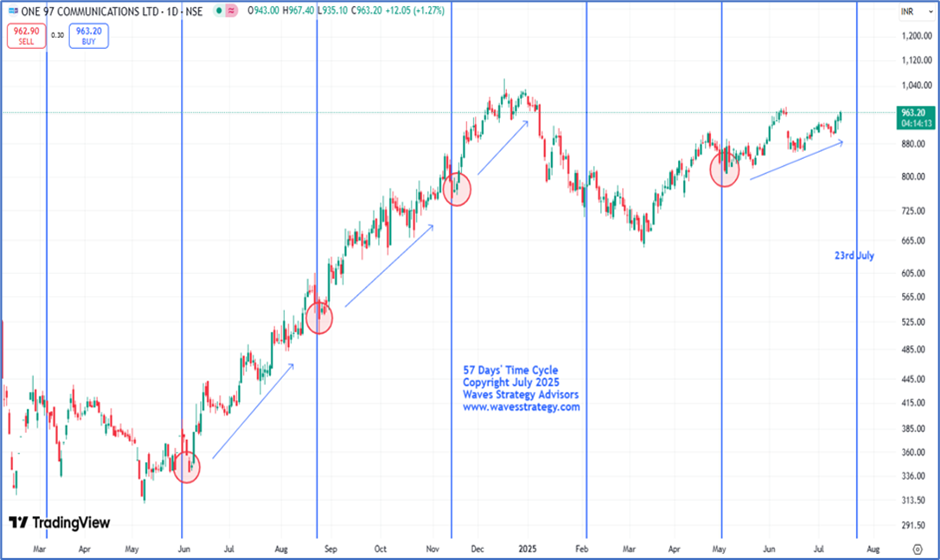
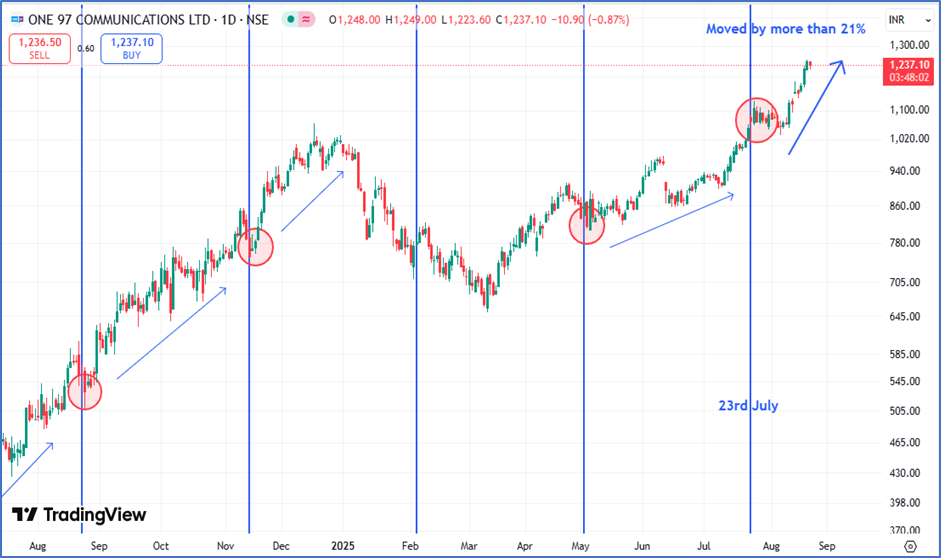
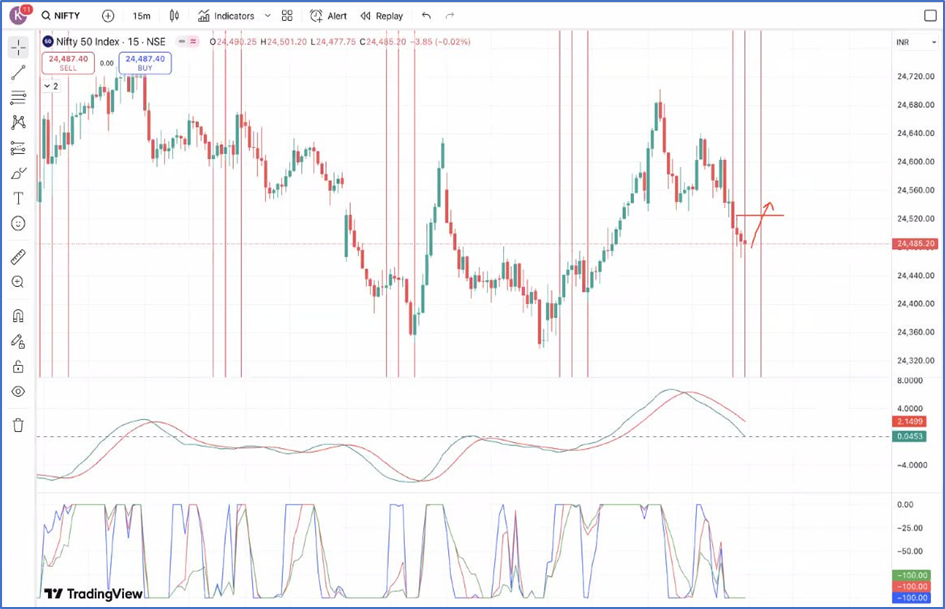
Kaal Chakra (Master of Cycles) – Learn the science of Hurst’s Time cycle along with Gann square of 9, KST momentum indicator, Pring Special Time indicator, FLD for price target in upcoming 23rd – 24h August 2025 training sessions – know more over here
Brahmastra (Mentorship on Timing the market) – Over period of 3 months equip yourself with all the tools to trade the market with an edge of Time, application of Elliott wave & Neo wave to predict future movements, Options strategy, access to a private community group, stock selection scanner, Multibagger and Momentum stock identification technique, Mentorship sessions for the complete trading journey Know more here