Friday, December 29, 2023

NIFTY Bang On: Power of Neo wave and Gann Level

We derived path and posted it on our tweeter handle yesterday. Below is the chart which shows a detailed analysis of Nifty which we tweeted on 28th December 2023.

Nifty Anticipated chart on 28th December 2023


Anticipated as on 28th December 2023 on our twitter handle

#Nifty Neo wave path shows we are in wave e of Diametric pattern which can take prices to 21820, post which expecting profit booking but then again move beyond 22k, buy the dips & it has been since many weeks I am telling this is mother of BULL markets! Are you riding with me

Nifty Happened as on 29th December 2023


Nifty moved up and almost achieved our target of 21820 and made high of 21801.45 in yesterday’s trading session.  Prices on the upside took resistance exactly from the mentioned level as we mentioned in our twitter and from there on Nifty witnessed profit booking. We successfully captured this move using pure Neo wave. We can expect some more profit booking and then a fresh leg on the upside with the targets of 22000. Currently the support for Nifty comes at 21580 level.

Sutra of Waves - SOW (20-21 Jan 2024) Live. Learn Waves Sutra (Neo Waves), Catching Major Tops and Lows, Fibonacci Trading System, Ichimoku Cloud and much more. Be a part of this upcoming Program, Limited seats only. Know More


Thursday, December 28, 2023

Gold: Bang on, what is next?

Gold continued to move in strong uptrend. Gold is following classis Elliott wave theory. Elliott wave helps us to navigate the trend of the market. See below how it has helped to derive path for Gold.

Look at below the charts and detailed research on MCX Gold taken from our Monthly research report of December 2023 –The Financial WavesMonthly Update

MCX Gold Weekly chart Anticipated as on 14th December 2023 


MCX Gold Daily chart Anticipated as on 14th December 2023 


MCX Gold Historical performance Anticipated as on 14th December 2023 


  Wave analysis as on 14th December 2023:

During the month of November Gold witnessed rally of more than 7% and not only achieved our target of 62000 but also moved way above it. During this whole year Gold surged more than 16%. Gold prices have almost always risen as the economy weakened.  A weakening US dollar, Hawkish stance of Federal reserve were one of the reasons for this rally.

Since last 5 years Gold has shown a rise of more than 118% which can be seen in the above chart.

Year

Closing % change

December 2018

3.79%

December 2019

2.83%

December 2020

4.94%

December 2021

0.61%

December 2022

3.94%


The above table is showing interesting data from history. This is saying that since past 5 years Gold has closed on a positive note at the year-end i.e. in the month of December. So, history is suggesting that this year also we might get a close of December series on a positive note.

Now let us look at Technical perspective. On the weekly chart, we can see that after making a fresh record high prices witnessed rejection from the upper bands. Prices still have not given a close below previous week’s low which keeps overall tone on to positive sign. A close below it will be a first of weakness. As we know that wave 3 of (3) is ongoing on the upside which is a strongest one as per guidelines.

On the daily chart, prices are still trading above the cloud. After a sharp rally chances of profit booking continuation are there. However, as long as price stays and holds above the cloud medium term bias remains positive. As per this, nearest support can be placed at 60200 levels. 

In nutshell, outlook for Gold remains positive. A breach above 62850 is must to resume uptrend with the targets of 63800-64100. While on the downside 60200 is the support. If prices manage to give a break below 60200 then it will be a sign of concern.

 Gold Daily chart Happened as on 28th December 2023


Prices moved precisely in sync with our expectations and as mentioned since it was an impulsive rise, we achieved our target 1 of 63800 levels. It has potential to achieve our target 2 of 64100 levels. We have been able to capture movement of more than 3.9% in just 10 trading sessions.

For now, trend remains positive and one can use dips as a buying opportunity with the targets of 64100 levels. 

Sutra of Waves - SOW (20-21 Jan 2024) Live. Learn Waves Sutra (Neo Waves), Catching Major Tops and Lows, Fibonacci Trading System, Ichimoku Cloud and much more. Be a part of this upcoming Program, Limited seats only. Know More

Wednesday, December 27, 2023

WOCKPHARMA Bang On- 2 Best Indicators You Cannot Miss!

It is possible to capture massive moves in stocks using price patterns along with simple indicators like the ADX (Average Directional Index).

We used these 2 indicators on WOCKPHARMA and were able to capture a 56% move in a short span. You can also use these to identify stocks with momentum for short-term trades.

We published WOCKPHARMA analysis in "The Financial Waves Short Term Update" on 15th November 2023 which our subscribers receive pre-market every day. Check out below the detailed research report that we published.

WOCKPHARMA Weekly Chart Anticipated 15th November 2023 


WOCKPHARMA Daily Chart Anticipated 15th November 2023 


  Wave Analysis as on 19th December 2023

WOCKPHARMA has been moving higher recently and intact in strong uptrend. In the previous session it closed with a massive gain of 10.92%. On the weekly chart, in the previous session prices formed a bullish candle.

Stock has formed a classical reversal pattern inverted head and shoulders which indicate a bearish-to-bullish trend reversal and also suggest accumulation pattern. Now weekly close above 270 level will confirm breach of neckline of the pattern and suggests that move towards 315-320 zone has started where conservative target as per right shoulders is placed.

As shown on the hourly chart, we have applied parabolic SAR which used to determine the price direction as well as draw attention to when the price direction is changing. A series of dots placed below the price which is deemed to be a bullish signal. Closest support is placed at 270.In short, trend for this stock is positive. Use dips towards 280-282 as a buying opportunity for a move towards 315-320 levels as long as 270 holds on the downside.

WOCKPHARMA Weekly Chart Happened as on 27th December 2023 


Happened: After we published the report, the stock made a dip exactly towards 280 levels which we mentioned earlier. Within the short span of time, the stock has given more than 56% return in such volatile market and moved way beyond our target which was of 320 levels. Stock made high of 428.85.

Sutra of Waves - SOW (20-21 Jan 2024) Live. Learn Waves Sutra (Neo Waves), Catching Major Tops and Lows, Fibonacci Trading System, Ichimoku Cloud and much more. Be a part of this upcoming Program, Limited seats only. Know More

Tuesday, December 26, 2023

HCL TECH: Price targets using Elliott wave!

IT Sector continued to outperform and we have been Bang on in anticipating up move in HCL Tech.

We published detailed research on HCL Tech on 18th September 2023 and we achieved our target level as our studies showed. Below is the chart we published in our monthly report, “The Financial Waves MonthlyUpdate”.

HCL Tech Weekly Chart: (Anticipated as on 18th September 2023)


Wave analysis as on 18th September 2023

Elliott Wave analysis: As shown in the weekly chart the prices have shown an excellent rise and are moving precisely within the multi-year channel. HCL Tech is moving in primary degree wave (5) and now we are seeing the rally in the form of intermediate wave iii. The third wave is usually the largest, most violent. Wave iii has retraced more than 78.6% of prior wave ii.

Indicator Analysis:  A Moving average offers a strong support during the dips during rallies. We have found the 100-week EMA, which has successfully supported rallies in the past. As important lows have occurred near this average. So, dip towards it can be used as an excellent buying opportunity. As recently in month of July, when prices moved toward the rising 100-week EMA, stock shown a strong comeback from it. If a similar opportunity arises in the future one can use it as an added advantage to ride the trend.

Time Cycle: On the weekly chart, HCL Tech is following with 82 Period Time cycles. This cycle has been incredibly effective at catching lows every 82 weeks. The stock has seen a strong rally from the Covid 2020 bottom, which was also on this cycle. Recently prices made low near our cycle a bounced back on the upside precisely. During last week cycle has turned on to positive as prices gave a break above 1171 which was a swing high.

Time and Wave theory along with price action all are in sync and giving us hints of more possible up move in this stock in coming sessions.

In short, trend for HCL Tech is positive and it can continue to move higher towards 1400 levels followed by 1450. If Price dips towards the trendline which comes near 1200 then it will provide a classic buying opportunity. While on the downside 1171 can act as a near term support which is a cycle low.

HCL Tech (Happened as on 26th December 2023)


Happened

Post recommending this stock, prices moved as expected. After a dip, stock showed a good rally and achieved our target of 1450. We have seen movement even beyond it as prices made high of 1509. Prices from the lows moved more than 24% within less than 3 months of span.

The current rise is in form of iii. For now, one can use buy on dips approach to ride the trend as long as 1350 holds on the downside.

Options Mantra -OM (16-17 Dec 2023) Online Videos and Sutra of Waves - SOW (20-21 Jan 2024) Live. Learn 5 Options Mantras, Waves Sutra (Neo Waves), Catching Major Tops and Lows, Ichimoku Cloud, and Keltner Channel. Both these modules is called BMW -Trishul, Know More 

Friday, December 22, 2023

Multibagger Stock: TVS Motors up by 80% in just 8 months!!

It is possible to capture a massive move in a shorter time frame with the help of Time cycle and simple Elliott wave.

We had recommended to buy TVS Motors in our Multibagger stock report back in April 2023 around 1135 levels! Below shows a detailed chart and analysis that the stock followed.

TVS Motors Weekly Chart Anticipated as on 28th April 2023


Wave analysis as on 28th April 2023

As shown in Weekly chart, since 2013 this stock is intact in big upward moving red channel. Within this channel we have seen different phases in prices such as bull phase and bear phase. Prices started moving in an impulsive manner. Wherein, wave 1 completed near 770 levels and then primary wave 2 started moving on the downside and completed in form of corrective pattern near 490 levels. Wave 2 took 4 years to get complete and then primary wave 3 is unfolding on the upside which is considered as a most impulsive one.

On the weekly chart, 150 period Exponential Moving Average is acting as a brilliant support line and it has provided support at regular intervals. This suggest that one should be in the direction of the ongoing trend as far as this line is protected. As per this, nearest support can be placed near 770 levels. Also, MACD is showing positive crossover which is acting as a double confirmation

Time cycle: As we can see that how after every 106 weeks near the vertical line an important low is formed with a slight variation of one of two candles. Recent low was formed on our cycle and since then a good rise was seen. This stock has been outperforming since past many years and it has great potential to continue its up move in coming years. So, it is advisable to create long positions in this stock but in a staggered way.

In nutshell, Elliott wave theory along with time cycle suggests that long term bull trend is ongoing in TVS motors. One can start buying this stock at current levels and add on dips towards 965 and can maintain stop around 770 price levels and Conservative target for this stock can be maintained at 2050 levels on the upside which is also the upper resistance of the channel.

TVS Motors Weekly chart (Happened as on 22nd December 2023)


Happened

We have published in our Multibagger Report on 28th April 2023 in which we have covered a stock named TVS Motors. At the time of the update the stock was trading around 1135 levels. Recently stock has achieved our target of 2050 and made high of 2058.5. Stock has shown movement of more than 80% just 8 months of span!

Time Cycle and Elliott wave works brilliantly if one knows how to apply it correctly. So, using Time cycle one can derive path ahead for intraday and positional on stocks and even on index as well.

Options Mantra -OM (16-17 Dec 2023) Online Videos and Sutra of Waves - SOW (20-21 Jan 2024) Live. Learn 5 Options Mantras, Waves Sutra (Neo Waves), Catching Major Tops and Lows, Ichimoku Cloud, and Keltner Channel. Both these modules is called BMW -Trishul, Know More 

Thursday, December 21, 2023

HDFC Bank 53 Day’s Time Cycle working like magic!

Time Cycle helps to understand if the overall trend is going to reverse back on upside. This is advanced technical analysis method for timing the market.

HDFC Bank is following 53 Day’s Time cycle very well and we can clearly see that prices are forming low every time it approaches near to this cycle. See detail research below which is picked up from our daily Equity report which our subscribers receive daily before market opens.

See below how we have predicted this early move with the help of Time cycle!

HDFC Bank Daily chart (Anticipated as on 5th December 2023)


Analysis as on 5th December 2023

HDFC Bank has been rising over the past few days.  In the prior session, the stock finished the day up by 3.47%. 

HDFC Bank is following 53 Day’s Time cycle very well and we can clearly see that prices are forming low every time it approaches near to this cycle. Time Cycle helps to understand if the overall trend is going to reverse back on upside. As shown in above chart prices are bouncing back every 53 days. Recently prices made a low near our cycle which was near 1460-1470. Following that, the stock reversed to the upside and is still in an uptrend.

Prices closed above the previous day's high in the previous session, indicating a positive signal. Furthermore, prices have recently closed above the Ichimoku cloud. So, Time cycle, Indicators, and Price action are all in sync, indicating that the outlook for this stock is positive.

In short, trend for this stock is positive. Use dips as a buying opportunity for a move towards 1650 levels as long as 1560 holds on the downside.

HDFC Bank 53 Days cycle (Happened as on 21st December 2023)


Happened

HDFC Bank moved precisely and after a dip moved up and achieved our target of 1650. In today’s session prices made high of 1676. HDFC Bank is the only stock from banking sector which has managed to stay at the top even when major Indices showed a sharp fall. We have witnessed power Time cycle which can be seen above chart.

For now, trend for HDFC Bank remains positive and soon we can expect a move towards 1700 levels. 

Options Mantra -OM (16-17 Dec 2023) Online Videos and Sutra of Waves - SOW (20-21 Jan 2024) Live. Learn 5 Options Mantras, Waves Sutra (Neo Waves), Catching Major Tops and Lows, Ichimoku Cloud, and Keltner Channel. Both these modules is called BMW -Trishul, Know More 

Wednesday, December 20, 2023

Tata Consumer Bang On- Combining Elliott wave with Time cycle, You cannot Miss!

 We are seeing the best of FMCG sector stocks rally since past few trading sessions. We have been Bang on in anticipating this up move in TATA Consumer.

We published about Tata Consumer in November 2023 and predicted a possibility of good returns in the coming months in our Monthly Research report. Check out the research we had published on 17th November itself – Below is the detailed analysis of Tata Consumer and derived targets of 970 levels using Elliott Wave technique and Time cycle.


TATA Consumer weekly chart Anticipated as on 17th November 2023


TATA Consumer Daily chart Anticipated as on 17th November 2023


Wave analysis anticipated on 17th November, 2023


Tata Consumer products has shown strong outperformance over the years. Looking at the pattern development we expect this stock has further potential in the coming times! First chart shows that when FMCG sector is struggling to give breakout of the range and continued to move in a consolidation, however this stock has continued to rise and moving up in form of higher high higher low fashion. Let us understand detail Technical outlook of Tata Consumer for coming month.


In the weekly chart of Tata Consumer products, the stock is trading near the lifetime high levels. Stock is moving well within a Multiyear upward tilted channel. It completed primary wave 4 near 692 levels. Since then, the fifth wave has been unfolding which is further sub dividing. Internal structure of primary wave 5 indicates that prices completed intermediate wave ii near the trendline support and currently intermediate wave iii is unfolding on the upside. We have shown projection of wave iii. As per this, we expect wave iii to retrace 1.618% of wave I which comes near 1125 levels.


We have plotted Time cycle of 76 weeks. Tata Consumer is following 76 period Time Cycle as can be seen in the above chart. Red vertical line represents Time Cycle. We can see prices have bounced from near our cycle. Recently cycle turned onto buy side after a dip. So, we can expect upward momentum in this stock in coming sessions.

On the weekly chart, we have shown ichimoku cloud. Prices have closed and sustained above the Ichimoku cloud. Ichimoku can act as a support cushion. As per this, nearest support is near 810 levels.

To understand momentum, we have shown RSI which is trading above 60 which suggests that a good momentum can be seen.

In a nutshell, trend for Tata Consumer looks positive. A decisive breakout above 930 can open upside targets of 970 and finally to our ultimate target of 1128 which is 1.618 times of wave i. While on the downside 810 is near term support levels.

Happened:

TATA Consumer daily chart (Happened as 20th December 2023)


As we predicted 1 month back if this stock give breakout of 930 levels on the upside then a good rally can be seen with the targets of 970. This tock has managed to surpass our target 1 level of 970 and recently made high of 991.30 which is more than 9% move in less than 1 month of span. This up move we have been able to capture with the help of Elliott wave, Time cycle along with price action.

Stock is currently heading towards our target 2 which is near 1128 levels. So, one can use buy on dips method for now with the targets of 1128(which is 1.618% of wave i) as long as 940 holds on the downside.

To know the in-depth analysis from Elliott wave perspective, get access to the “The Financial Monthly Update”. You can also find detailed analysis on Outperforming sectors and Global market views Subscribe here

Options Mantra -OM (16-17 Dec 2023) Online Videos and Sutra of Waves - SOW (20-21 Jan 2024) Live. Learn 5 Options Mantras, Waves Sutra (Neo Waves), Catching Major Tops and Lows, Ichimoku Cloud, and Keltner Channel. Both these modules is called BMW -Trishul, Know More 


Tuesday, December 19, 2023

Multibagger stock for trading using Elliott wave!

Elliott wave is a simple yet powerful technique to form a good trading setup!

It is important to understand this concept properly before trading or investing. If applied prudently with proper understanding it is very much possible to take investment or trading decisions right from the smallest time frame for Intraday trading to long term charts for investment decisions.

See below research how we have derived path ahead for SHYAMMETL which is picked up from our "The Financial Waves ShortTerm Update" which our subscribers receive pre-market every day.

SHYAMMETL Daily chart path ahead


SHYAMMETL is trading at the fresh record high. In the previous session, stock closed with a gain of 0.51%. Stock is moving up by following classic Elliott wave theory. Currently Primary wave 3 is ongoing on the upside. As per guidelines wave 3 is the strongest one. Primary wave 2 got completed near 422 levels and since then we witnessed a rise of more than 27%.

In this entire rise base line(red) of the Ichimoku cloud has acted as a support cushion to prices. So, one can continue to go long as long as prices holds and stays above the base line which is near 492 levels. KST is suggesting that good momentum is likely to continue in this stock.

In short, outlook for SHYAMMETL is positive. Use buy on dips approach to ride the trend with the targets of 560-565 as long as 492 holds on the downside.

So, one can easily form trade setups or can derive path using Elliott wave, Fibonacci and KST! It works brilliantly if one combines it together.

Options Mantra -OM (16-17 Dec 2023) Online Videos and Sutra of Waves - SOW (20-21 Jan 2024) Live. Learn 5 Options Mantras, Waves Sutra (Neo Waves), Catching Major Tops and Lows, Ichimoku Cloud, and Keltner Channel. Both these modules is called BMW -Trishul, Know More 


Monday, December 18, 2023

Trading Momentum stocks to generate 8% returns!

By combining Elliott wave method along with patterns and price action it is possible to capture massive moves in stocks.

Check out how we selected Momentum stocks and was able to capture a Short-term move of 4% to 8% within a short span!

CLEAN Hourly Chart (Happened)


CLEAN was about to give a breakout of important resistance. Along with this, Elliott wave counts was also in sync. Once price action confirmed that’s when we shot the calls to our momentum advisory clients.

Along with this, the current rise is in form of wave iii of 3 which is considered as a strongest one. Stock generated 3.5% returns in short span!

Below are the momentum stocks which we picked up in the Month of November 2023.

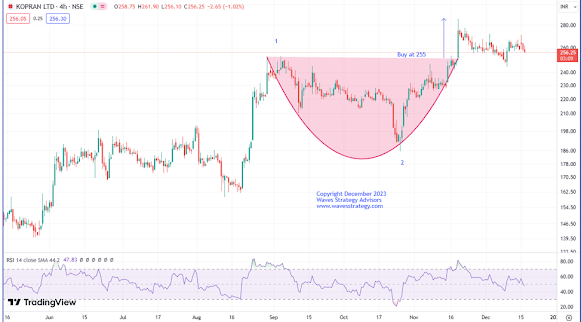
KOPRAN Hourly Chart (Happened in November 2023)


KOPRAN achieved our target of 280 which is an 8% move from a single day!

KPRMILL Hourly chart (Happened in November 2023)


KPRMILL also showed move of 8% from our buying levels.

Below is the list of past 8 months calls performance for momentum!


In short, even the most basic Elliott wave technique can work its magic when combined with price action! Especially, if you know how to apply it correctly.

Subscribe to momentum advisory calls directly over here and get added to our premium telegram group. Click to subscribe to momentum research.

 Options Mantra -OM (16-17 Dec 2023) Online Videos and Sutra of Waves - SOW (20-21 Jan 2024) Live. Learn 5 Options Mantras, Waves Sutra (Neo Waves), Catching Major Tops and Lows, Ichimoku Cloud, and Keltner Channel. Both these modules is called BMW -Trishul, Know More 


Wednesday, December 13, 2023

JSW Steel: Price targets using Elliott wave!

Elliott wave have helped us to navigate the trend for the stock. JSW Steel continued to rally and achieved our target of 833 levels. Stock moved much higher and made a high of 862.8. You can also do that especially if you know how to apply Elliott wave along with technical indicator for powerful setups.

We published the following research on JSW Steel pre-market on 1st December 2023 in "The FinancialWaves Short Term Update" which our subscribers receive pre-market every day.

JSW Steel Daily chart as on 1st December 2023 (Anticipated):

JSW Steel Daily chart as on 13th December 2023 (Happened):


Wave Analysis as we published on 1st December 2023:

JSW Steel have just given a close above previous swing high. This is a good sign but follow up buying is must. In the previous session, stock closed with a gain of 0.99%. Along with this, supertrend has also just turned green. As per wave perspective, wave A is ongoing on the upside. So, overall signs are suggesting that outlook is likely to remain positive for coming sessions.

On the hourly chart, prices are moving up within an upward sloping channel. Wave c is unfolding on the upside. To understand wave pattern, we need more price action. Also, in this entire rise base line of the Ichimoku cloud has acted as a good support. So, any dip towards the same i.e. towards 794 would provide excellent opportunity to go long. 

In short, JSW Steel looks positive. A break above 810 can lift the price higher towards 833 as long as 787 holds on the downside.

Happened:

We can see that how wave count has helped us to find out the trend reversal for JSW Steel well in advance. After completing wave X near 724 levels we had mentioned possibility of up move in form of wave A and the stock moved as we expected. On December 1 2023, we derive target of 833 levels which was achieved within just 3 trading sessions. Stock moved way higher and made high of 862.8.

Options Mantra – (OM) Learn the science of Trading Options using 5 powerful mantras in upcoming Options trading program on 16th – 17th December 2023. Methods can be applied directly on stocks or on Options chart. Limited seats only. Know More


Monday, December 11, 2023

Options Trading – 3 Powerful Indicators Must for Trading!

Options trading requires understanding of Momentum along with significant movement as per Bands like Keltner channel or Bollinger Bands®

Which are the Powerful Indicators to use for Options buying?

Nifty post showing sharp rise on upside is now moving in a range with Option prices not moving in any direction.

Nifty 21000 Call Options 28th December 2023


Nifty 21000 call options month end expiry 15 minutes chart is shown above that has three powerful indicators – Volume profile, Keltner Channel and KST indicator.

Volume profile – This indicator helps to understand the area where major volume has taken place. We can see that 229 is the level where lot of activity has happened in this option price with value area low near 150 levels.

Keltner channel – shows the possible area of breakout. Prices are as of now whipsawing around the volume area within the bands. Now any break above 268 levels which is the upper end of the Keltner channel and confirm prices are also breakout from the volume profile area.

KST indicator -  this indicator is back to the 0 line indicating sideways action and we will get further confirmation once prices break above the recent high.

Thus all the indicators will get in sync once there is a clear break above 268 levels with immediate support near 200 on downside.

 In a nutshell, one can combine 3 powerful trading indicator to trade options directly.

Options Mantra – (OM) Learn the science of Trading Options using 5 powerful mantras in upcoming Options trading program on 16th – 17th December 2023. Methods can be applied directly on stocks or on Options chart. Limited seats only. know more

Thursday, December 7, 2023

Trading KST indicator with Keltner Channel Breakout on Nifty

 Nifty and Bank Nifty touched lifetime high levels where Nifty is at a kissing distance from 21k mark.

Using momentum indicators along with breakout techniques that can help in capturing the entire up move is important.

Nifty 15 minutes chart:


In above chart of Nifty we can see two important indicators that are focused on prices and momentum.

Keltner channel – This indicator is different than that of Bollinger Bands®. Bollinger Bands uses standard deviation to the mean whereas Keltner channel is derived using Average True Range (ATR). Both of the indicators have different way of application.

In Keltner channel we can see that break above 19810 on 28th November was the 1st break above the upper band of Keltner.

KST momentum – Breakout on Keltner channel was also accompanied by KST momentum indicator. KST momentum indicator broke above 0 line and also the signal line thereby giving strong confirmation that momentum is picking on upside.

In entire up move prices have not moved below the lower Keltner channel and KST is now back to the 0 support area. This can be a pause before the resumption of trend but a classic signal can be expected when both these techniques again get synchronized.

In a nutshell, Keltner channel helps to understand if the size of candle is increasing which is suggesting a significant move and KST further provides confirmation of momentum. Price action above 20970 will result into another synchronous signal from these indicators.

TRISHUL - Become Market Wizard(BMW) – Learn the complete application of Keltner channel along with KST indicator, Supertrend, Moving average crossover system and Price action as 5 Mantras in upcoming 16th – 17th December Online Options Mantra (OM) program and 20th – 21st January 2024 for Sutra of Waves (SOW) covering Elliott wave, Neo wave along with Ichimoku Cloud. Early Bird ends on 10th December, Limited seats only. Know More