Sensex has been inching higher and touched lifetime highs of 60400 on 27th September 2021 and Nifty touched lifetime high levels of 17947.
In our monthly research published on 26th July 2013, we have clearly forecasted Sensex to touch 61000 in 9 to 10 years time frame and BankNifty to touch 40,000.
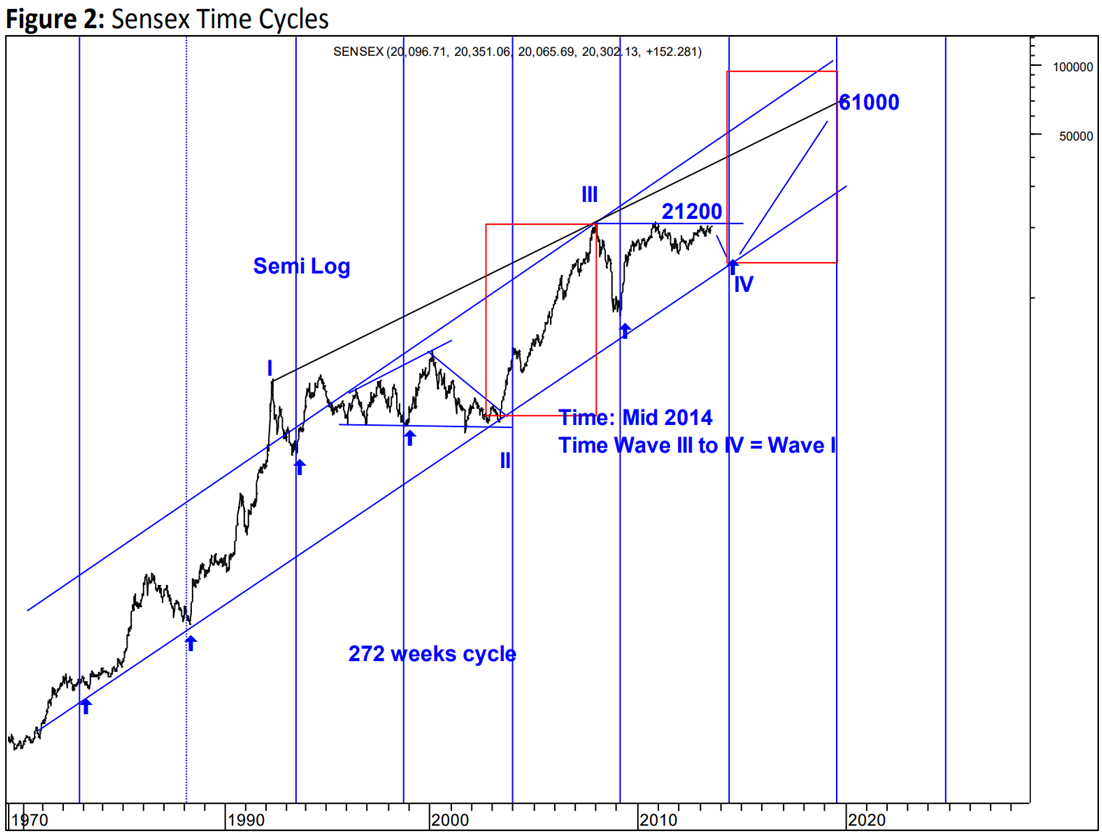
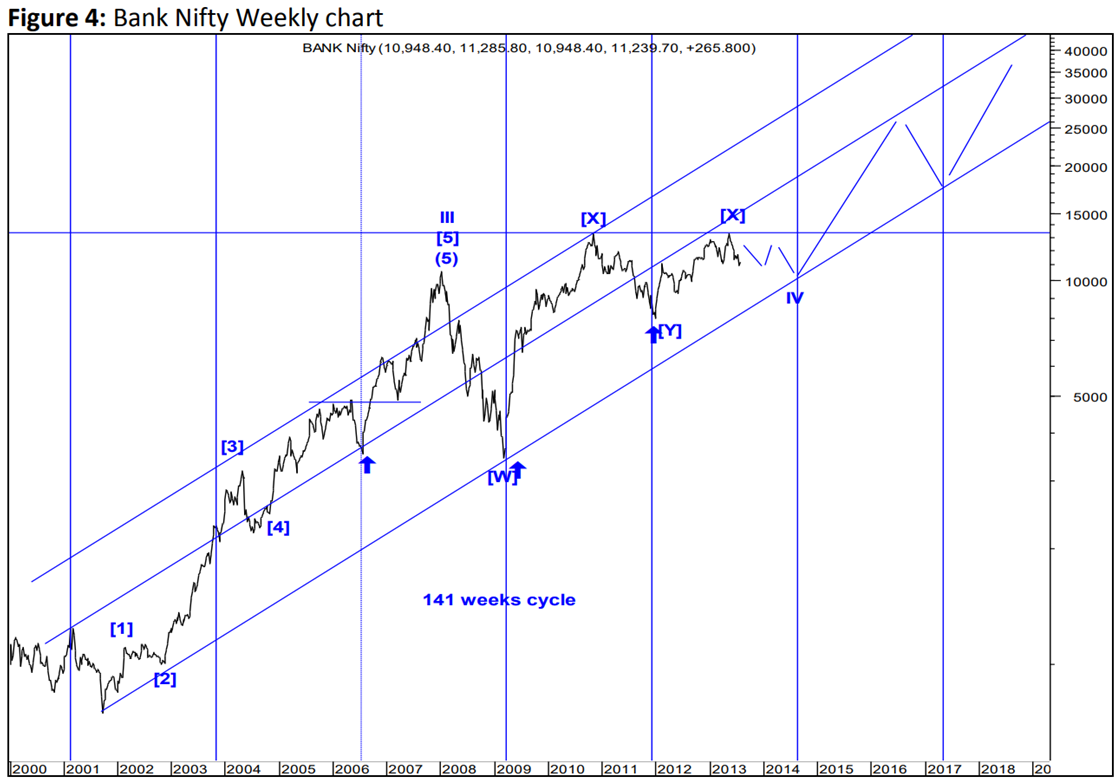
Yes, This is something that looks unbelievable but see the below charts which was shown in the research in the Year 2013 when Sensex was near 19000 and Bank Nifty was near 12000 levels.
Sensex and Bank Nifty chart shown in year 2013
 Following was mentioned in the year 2013-
In Figure 2 we are showing that Sensex can touch 61000 levels by 2020. 272 weeks bottoming Time cycles suggest lows should be formed by mid 2014. Time can be very dynamic and we have to give a leeway of + 10%. Time cycle is of 272 weeks and 10% gives 27 weeks of delay plausible. This can delay the start of new uptrend towards end of 2014 instead of mid 2014.
The target of 61000 is not overly optimistic. We have seen history, when from near 3000 levels Sensex rallied to 21000 i.e. an increase of 7 times in little over 5 years, Sensex was launched at 100 in 1979 and touched 21000 in early 2009 i.e. an increase of 210 times in mere 30 years. Such exorbitant value creations simply dwarf our estimation of 61000 in 6 to 7 years. At this juncture, the conjunction of Price and Time given by the above methods is compelling. It will be at this level of by mid 2014 that the market will by ripe to ride the next wave of bull trend on upside!
Following was mentioned for Bank Nifty in the year 2013
On Bank Nifty, the level of 26,000 & 40,000 might sound irrational or crazy at this point of time. But history shows that things that seem far of reach are still plausible if you apply objective techniques. The below chart itself shows that in 2002 Bank Nifty was trading at 900 levels and by end of 2007 it quoted at 10,000 levels. This is the power of a Bull trend. Bank Nifty increased multifold from 900 to 10,000 i.e. more than 10 times in 6 years. In 2002 when index was at 900 if someone would have predicted 10,000 people would have rejected that on the face and would have used the word “Crazy”. In 2009 March Bank Nifty was near 3400 level and by November 2010 the index touched 13300 levels i.e. a rise of almost 4 times in less than 2 years. But history of world markets let alone India has from time & again showed power that Bull trend has. In world financial markets everything that seems logical from fundamental perspective might not be so and everything that looks impossible might be one of the highest probable outcomes!
Happened: The above shows that we are off only by a few months that too it was mentioned that 27 weeks delay is possible and here we are now BANG ON! Both these indices moved precisely as we expected despite of various events including Mr. Modi win in central Election, Demonetization, Trump thrown out of power, Pandemic of 2020, tensions between China and India, Crude turning negative in year 2020 and many more such events.
In a nutshell, above clearly showcase that there is power in Technical analysis and Time Cycles to forecast right from years to the very minute and if one applied it correctly can forecast the fate of stock market despite of the fundamental scenario and dooms day that prevailed during Covid-19 pandemic, But our targets are almost achieved now predicted 10 years back, Thrilled Yet!
3 Months Mentorship on Timing the Markets - Learn to time the market and trade with me for the period of 3 Months including Live trading, stock selection, Momentum, and Multibagger stock identification, Timing the entry to the very Day, Hour, and Minute using Time cycles analysis. Early Bird ends on 10th October 2023. Fill the form below to know more about Mentorship, Contact +919920422202 for more details
Learn to Time the market to the very Day, Hour and at times to the very Minute with Lunar Cycles, Hurst's Cycles and Gann Time with simple & scientific methods. Click here to know more


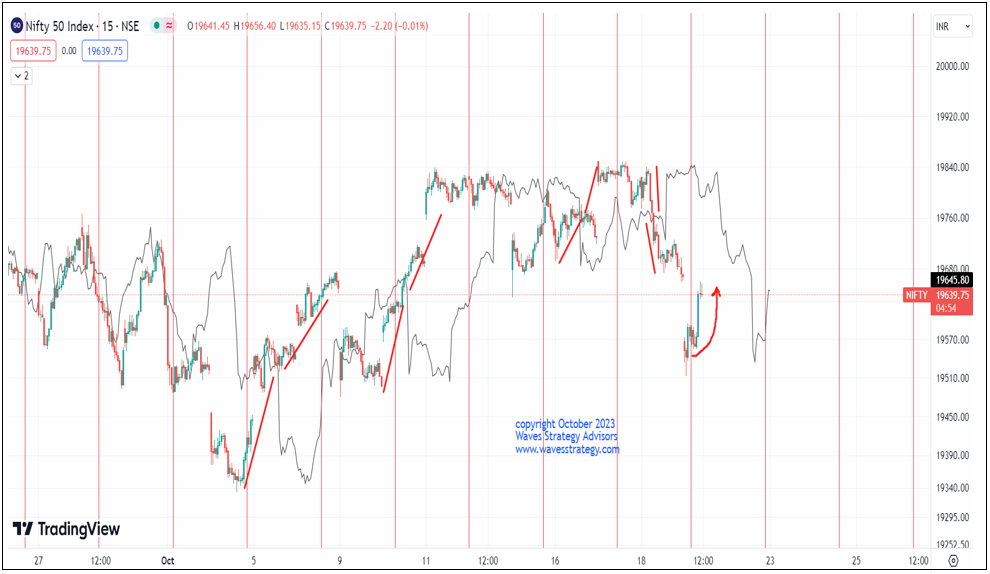
 The first chart shows the path for Nifty and targets on the downside which is picked up from our Friday (20th October 2023) webinar which we derived by using an indicator called

 Time is of the essence for trading successfully. By using Time cycles traders can even derive targets for price using the concept of Future Line of Demarcation (FLD)


