Tuesday, June 28, 2022
Announcement- How to use Time Cycles in Bear Market
Tuesday, June 21, 2022
#Nifty - Is wave a over down, target for this up move?
Friday, June 10, 2022
Nifty Trading Strategy using Volume Profile, OI and Time Cycles
Wednesday, June 8, 2022
#Nifty, Bank Nifty Key Levels, Bonds post #RBIPolicy #Trade Setup
Wednesday, June 1, 2022
Nifty 55 Days Hurst’s Time Cycle
Hurst’s Time Cycles can provide important time zones from where prices can reverse. Market movement is governed by cycles of Time. This means that the lows and tops are formed in rhythmic fashion and not randomly. Many thinks that events are the reason for the movement of stocks or indices but that is not the case.
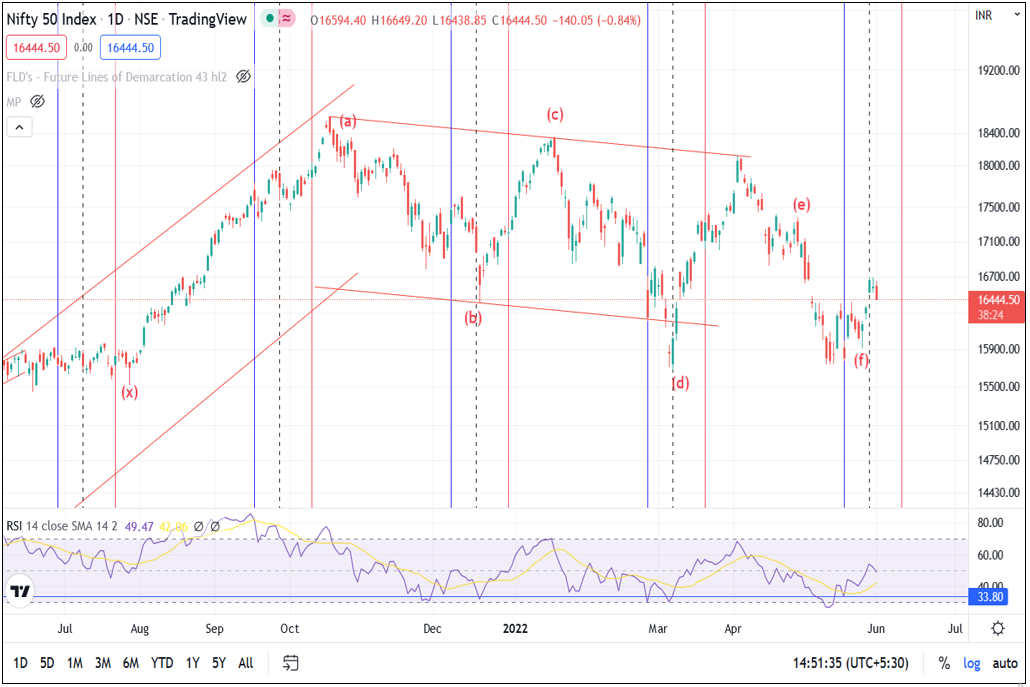
Below chart of Nifty shows 55 Days Hurst’s Time cycles
Nifty Time Cycles:

55 Days Time Cycle – In above chart we are showing 55 Days cycle. The original Time cycle (blue line) which we have been using for more than a decade indicated a low near 19th May 2022. Prices bounced back sharply from there and next day rallied by 450 points forming strong green candle. Low formed on 19th May was near 15775 which is still protected. We identified that there is a shift in this cycle which is represented by dotted black vertical line. So we got another date as 30th May 2022. Both these dates have worked out very well and Nifty again formed a low just 2 days prior to this shifted cycle. Now the overall tone will remain buy on dips as long as the low near 15900 remains protected. Nifty has rallied by more than 800 points from near this cycle as well.
There is a 3rd cycle represented by red line which is 55 days as well from the March 2020 lows. Post this cycle we have seen momentum in prices on upside. So we are keeping all these three time cycles which are 55 Days and working extremely well.
There is a way to trade these time zones and one needs to learn the science of doing it correctly. When a trader buys or sells a stock or index futures, it is both price and time that the trader is buying or selling. But majority are focusing only on element of price and not time which is equally important and above chart clearly reflects that if one is aware time is turning to buy then the focus will shift from sell on rise to buy on dips which will be like a battle half won. Remaining can only be techniques to enter the trend using methods of Elliott wave, Indicators, Moving averages or Ichimoku Cloud.
Mentorship on Timing the Market starts July 2022 – Become a part of #TimeTraders who are using this simple Time concept which is a science of Trading to trade with an edge. 3 Months of Mentorship starts in July 2022. Fill the form here for more details


