Nifty formed biggest weekly candle that too near the Time Cycle period. Is this resumption of the BULL MARKET?
Many have been on sidelines in the last 1500 points of up move seen on Nifty. Also, majority of stocks have shown sharp recovery on upside.
Nifty has seen sharp collapse from the top made in October 2024 until 10th March 2025 but recovered back a lot of the losses in just 1 week.
Look at the long term charts along with 85 weeks time cycle:
Nifty weekly chart: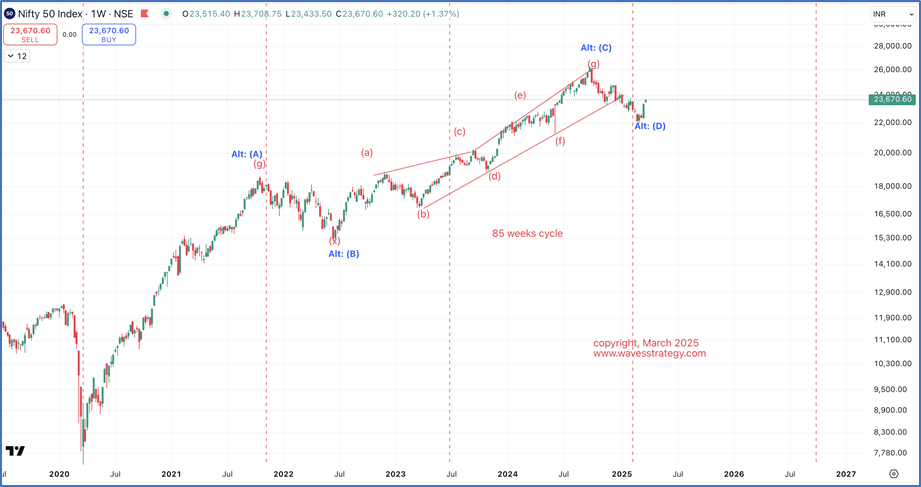 Neo wave analysis with Time cycle – Nifty long term Neo wave pattern suggests that the entire rise since the low of Covid 2020 has been in the form of Diametric pattern which consists of 7 legs. Prices might have completed wave D of the Diametric pattern and we might be just starting wave E on upside.
Nifty has formed the biggest positive weekly candle since the entire fall from October 2024. As per advanced Elliott wave this suggests that an important low is formed with completion of a bigger degree pattern.
85 Weeks Time cycle – Nifty 85 week’s time cycle has been useful in capturing most of the major lows except that of 2022 where it formed an inversion. This cycle was due again and prices happen to formed biggest weekly positive candle near this time cycle.
Combination of Neo wave with Hurst’s Time cycle is suggesting a possible medium to long term reversal on upside from here on. However, it is important to see short term dip that should protect the lows. A higher highs and higher lows on weekly time frame will further confirm resumption of major bull market again that many might miss out!
Exact path and targets from medium to long term will be provided in our monthly research report – Get access to Monthly research over here
In a nutshell, by combining advanced Elliott wave concept with Time cycle it is possible to forecast market but one needs to understand the risk and the probabilistic scenario.
Kaal Chakra (Master of Cycles) – Live two days of online training on Hurst’s Time cycles along with Gann square of 9, Price forecasting using Time (FLD) on historical charts with momentum indicators like Pring Special K and KST indicator. Limited seats only, know more over here
Brahmastra (Mentorship) – 3 months of mentorship with Multibagger Momentum stock selection algo creation, momentum trading, options strategy course, Elliott wave, Neo wave, Kaal Chakra, few seats left, Know more here


No comments:
Post a Comment