Elliott wave when combined with price action leads to interesting results. By using time cycle and wave theory together it can help predict capture reversals way before it has happened.
Time cycle is a powerful advanced tool which helps us catch reversal and identify recurring market price movements.
See the detailed report that we published in our monthly report on 14th December 2024
Muthoot Finance Weekly chart: Anticipated as on 14th December 2024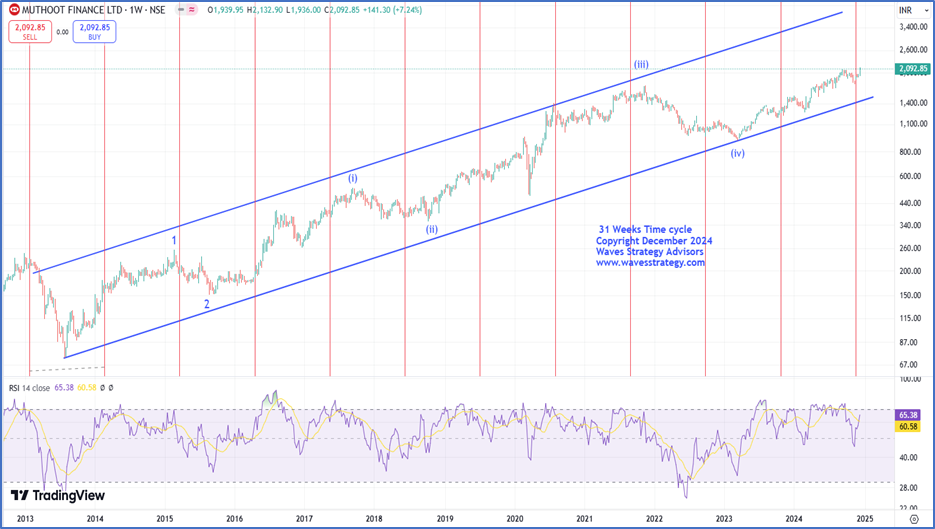
Muthoot Finance Weekly chart: Anticipated as on 14th December 2024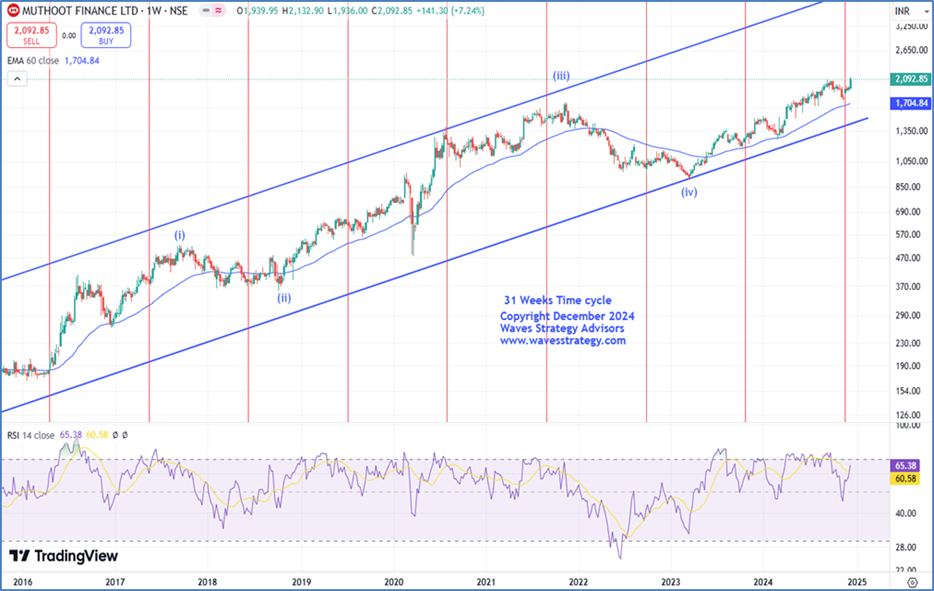 Wave Analysis as on 14th December 2024: -
Muthoot Finance comes under financial services sector. After 3 months of correction index have finally started to move up. Wherein, Muthoot finance has potential to show good rise in coming weeks. Let us understand detail analysis from technical perspective.
As shown on the weekly chart, prices are moving higher in the form of Impulsive Pattern. Wave 2 of Primary degree is completed on the downside near 153 levels and currently wave 3 is ongoing. The stock has shown an exponential rise in the form of wave 3 from the lows of 153 levels. Currently internal leg (v) is ongoing of wave 3. As shown in the weekly chart the prices have shown an excellent rise and are moving precisely within the multi-year channel.
Indicator Analysis: A good moving average tends to provide a good support on dips during rallies and resist price on pullbacks during downtrends. We have identified the 60-week EMA which has successfully supported rallies in the past and dips towards this average have acted as a great buying opportunity as major lows have formed at this average. If similar such opportunity comes again, one can make the most of it.
Time cycle: On the Weekly chart, we have a 31-period time cycle plotted, and it is really effective in capturing the major low points. We can see that our cycle precisely captured the recent low in November 2024 and after which a sharp reversal on the upside was witnessed. In the previous session, prices have given a close above previous swing high of 2080 which confirms that cycle has turned on the positive side. Now with follow up buying we can expect fresh rally in this stock.
In nutshell, we expect Muthoot Finance to provide greater gains in future. In a nutshell, trend for Muthoot Finance is positive and we can expect the stock to eventually move towards 2350 and higher. On the downside 1850 is the nearest support level to watch out for.
Muthoot Finance Daily Chart: Happened as on 27th March 2025: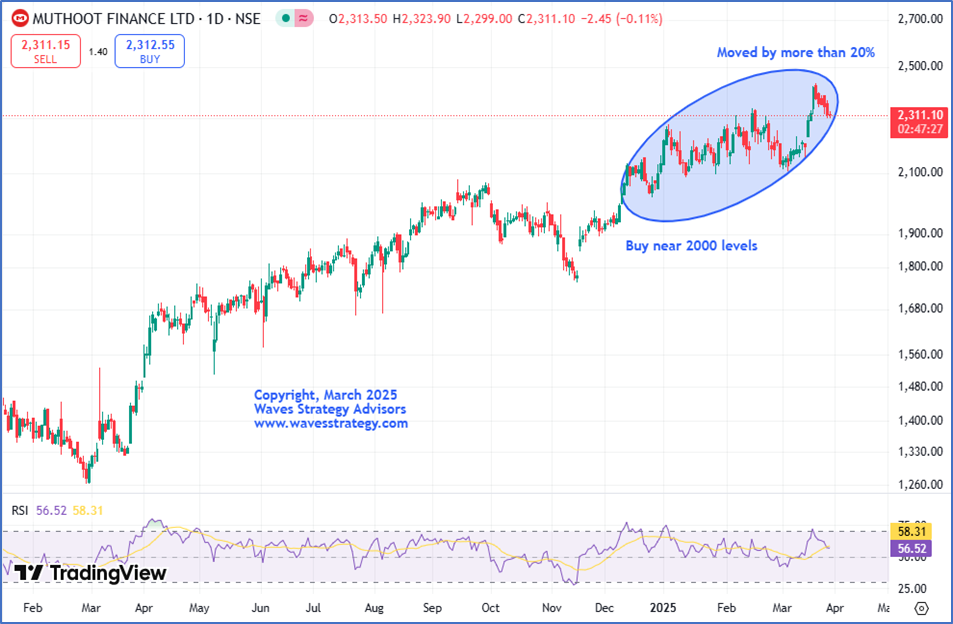 Happened- In our monthly report we expected prices to continue to show an impulse move as the stock was in wave (v) of Primary wave 3 and also cycle was on the verge to turn on the buy side. Bang on! The stock moved in sync with our expectations and saw a rise of more than 20% in just a matter of 3 months when all the major indices were falling. This is a sign of strength and we were able to predict this rise before it actually happened using Time cycle and wave theory. The stock successfully managed to achieve our 1st given target of 2350 levels and made a lifetime high of 2435 levels.
For such more powerful and strategic insides about stocks and indices, subscribe to our monthly report The Financial Waves Monthly update.
Kaal Chakra (Master of Cycles) – Live two days of online training on Hurst’s Time cycles along with Gann square of 9, Price forecasting using Time (FLD) on historical charts with momentum indicators like Pring Special K and KST indicator. Limited seats only, know more over here
Brahmastra (Mentorship on Timing the market) – Over period of 3 months Equip yourself with all the tools to trade the market with an edge of Time, Elliott wave, Neo wave, Options strategy, access to a private community group, stock selection scanner, Multibagger and Momentum stock identification technique, Mentorship sessions for the complete trading journey. Know more here


No comments:
Post a Comment