It is possible to Time the market by using concepts of Hurst’s Time cycle along with Gann square of 9.
It is crucial to combine price action techniques along with Time cycles and sacred science of Gann square of 9. This will give the much-needed edge for traders especially in Options trading.
Nifty 15 minutes chart - Anticipated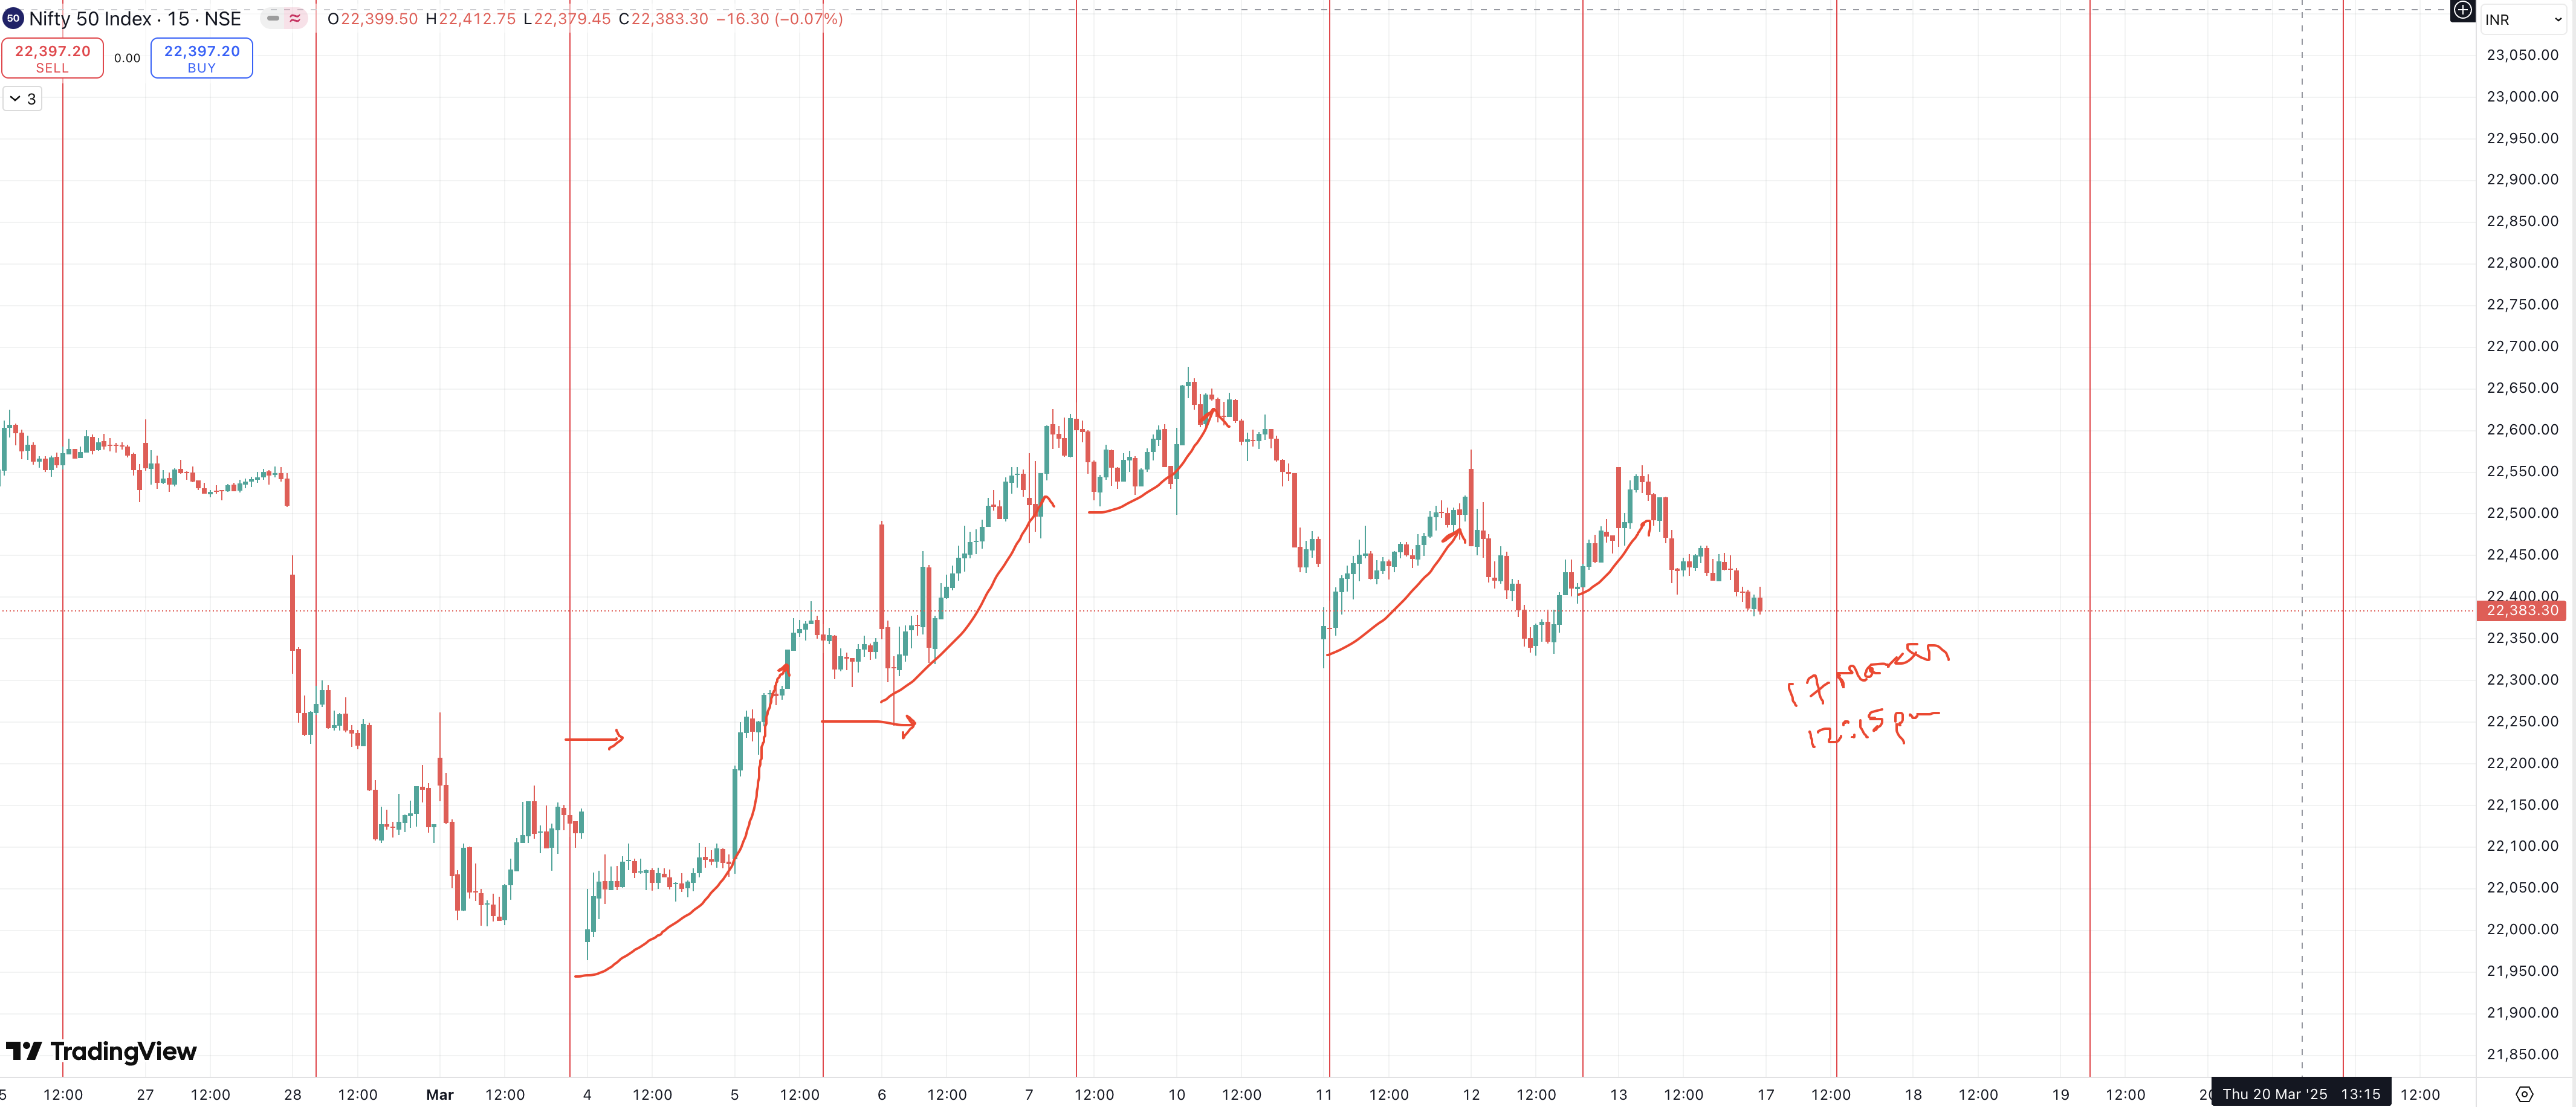 Nifty 15 minutes chart: Happened
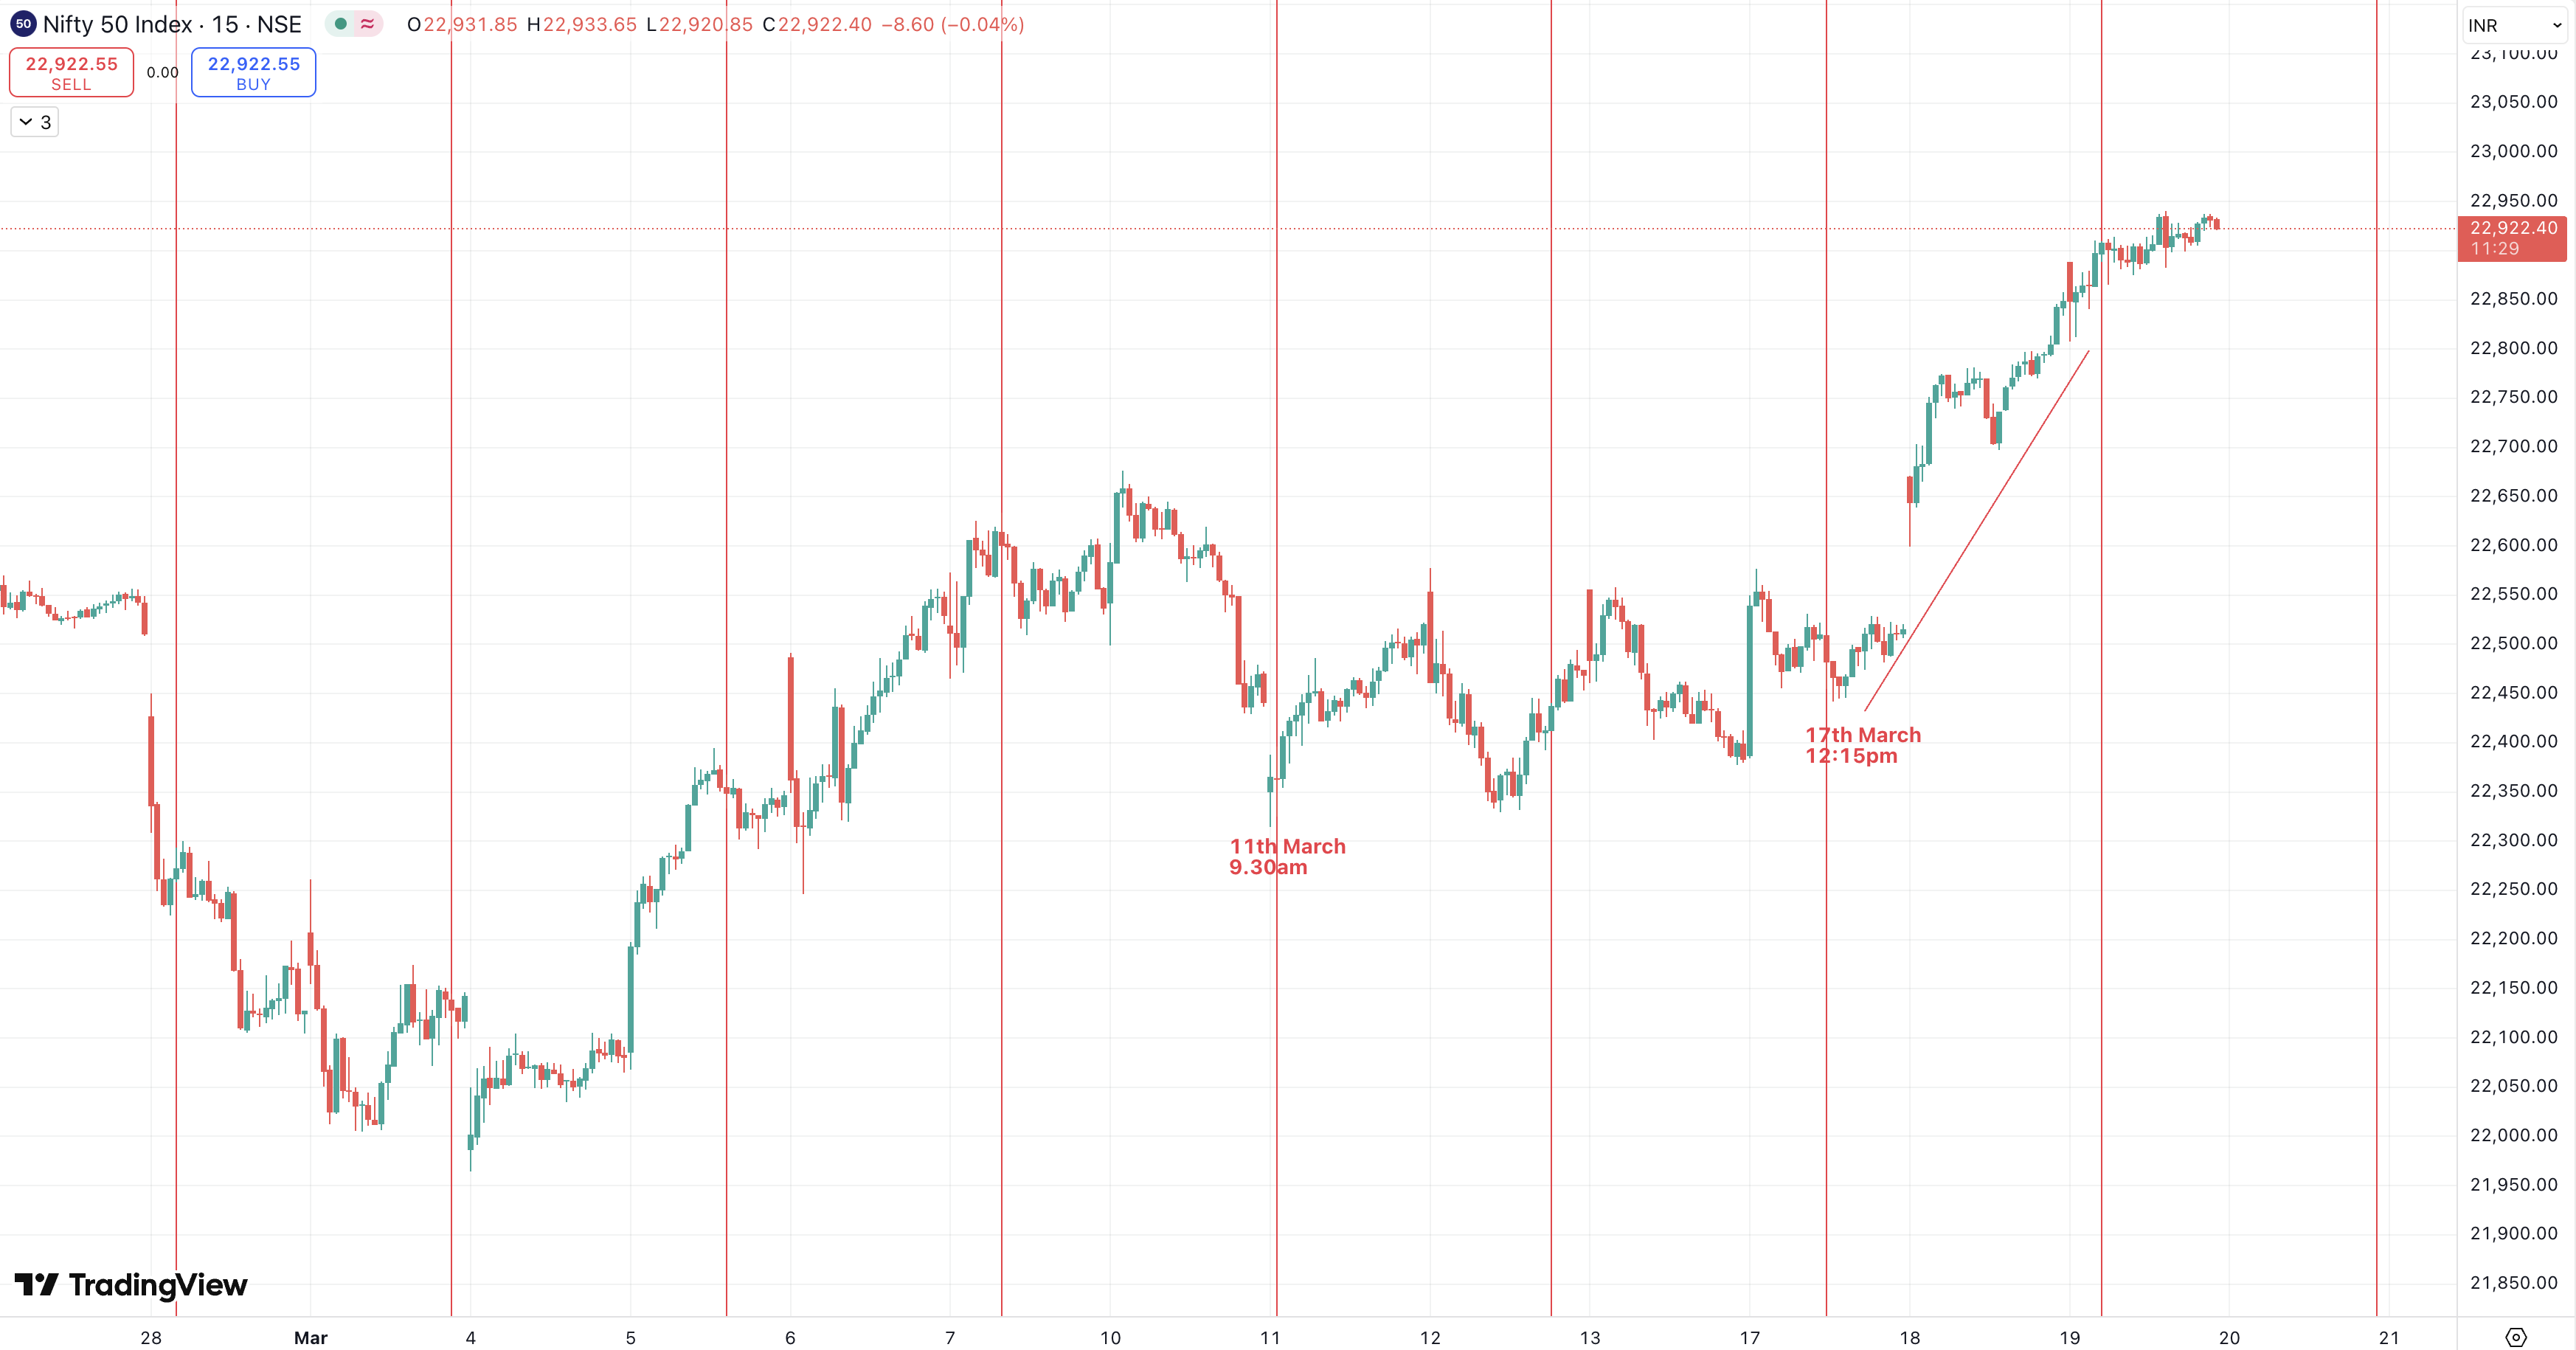 Nifty 15 mins chart shows 43 period Time cycle which is plotted as per Hurst’s Time cycle concept. As per this chart, prices have tendency to reverse on the upside.
Anticipated: We discussed this time when prices were near 22383 levels and expected an upside move from 17th March 12:15 pm.
Happened: Nifty formed a low near 23440 on 17th March and rallied by more than 500 points in less than 2 days. This clearly shows at times the concept of Time cycle works so precisely. This happened when majority of the traders were not sure about the direction of breakout and we mentioned that there is strong positive breakout possible as time turns up.
In a nutshell, by using Hurst’s Time cycles one can time the turn to the very day, hour and at time to very minute. It needs to be combined with Price action techniques. Also it is possible to forecast price targets using Time by using the concepts of FLD. Above that using Gann square of 9 provides complete trading system & different angle to see the markets.
Kaal Chakra (Master of Cycles) – Learn the science of Hurst’s Time cycle along with Gann square of 9, KST momentum indicator, Pring Special Time indicator, FLD for price target in upcoming 5th – 6th April 2025 training sessions – know more over here
Brahmastra (Mentorship on Timing the market) – Over period of 3 months Equip yourself with all the tools to trade the market with an edge of Time, Elliott wave, Neo wave, Options strategy, access to a private community group, stock selection scanner, Multibagger and Momentum stock identification technique, Mentorship sessions for the complete trading journey. Know more here


